EX-99.2
Published on August 3, 2023
Changes to Segment Reporting & Recast Financial Information August 2023 Exhibit 99.2
Disclaimer Statement Cautionary Statement Regarding Forward Looking Statements This presentation, including the oral statements made in connection herewith, contains certain statements and information that may constitute “forward-looking statements” within the meaning of Section 27A of the Securities Act of 1933, as amended, and Section 21E of the Securities Exchange Act of 1934, as amended. All statements, other than statements of historical fact, regarding Select Water Solutions, Inc.’s (“Select” or the “Company”) current expectations about its future results, including, but not limited to, statements about its strategy, future operations, financial position, estimated revenues and losses, projected costs, prospects, plans and objectives of Select’s management, are forward-looking statements. When used in this presentation, the words “could,” “believe,” “estimate,” “expect,” “may,” “project,” “will,” and similar expressions or variations are intended to identify forward-looking statements, although not all forward-looking statements contain such identifying words. These forward-looking statements are based on current expectations and assumptions of Select’s management about future events and are based on currently available information as to the outcome and timing of future events. Although we believe that the expectations reflected, and the assumptions or bases underlying our forward-looking statements are reasonable under the circumstances, we can give no assurance that such expectations will prove to be correct. Such statements are not guarantees of future performance or events and are subject to known and unknown risks and uncertainties that could cause our actual results, events or financial positions to differ materially from those included within or implied by such forward-looking statements. These risks and uncertainties include the risks that the benefits contemplated from our recent acquisitions may not be realized, the ability of Select to successfully integrate the acquired businesses’ operations, including employees, and realize anticipated synergies and cost savings and the potential impact of the consummation of the acquisitions on relationships, including with employees, suppliers, customers, competitors and creditors. Accordingly, investors should not place undue reliance on forward-looking statements as a prediction of actual results. Each forward-looking statement in this presentation speaks only as of the date of this presentation. Except as required by applicable law, Select disclaims any intention or obligation to revise or update any forward-looking statements contained in this presentation. Factors that could cause our actual results to differ materially from the results contemplated by such forward-looking statements include, but are not limited to, the global macroeconomic uncertainty related to the Russia-Ukraine war; central bank policy actions, bank failures and associated liquidity risks and other factors; actions by the members of OPEC+ with respect to oil production levels and announcements of potential changes in such levels, including the ability of the OPEC+ countries to agree on and comply with supply limitations; the severity and duration of world health events; the level of capital spending and access to capital markets by oil and gas companies, trends and volatility in oil and gas prices, and our ability to manage through such volatility; and other factors discussed or referenced in the “Risk Factors” section of our Annual Report on Form 10-K (our “Form 10-K”) and our other filings with the U.S. Securities and Exchange Commission (the “SEC”). There may be other factors of which Select is currently unaware or deems immaterial that may cause its actual results to differ materially from the forward-looking statements. The information contained in this presentation has not been independently verified other than by the Company and no representation or warranty, express or implied, is made as to the fairness, accuracy, completeness or correctness of the information contained herein and no reliance should be placed on it. Additional Information and Where to Find It For additional information regarding Select, please see our Form 10-K, Quarterly Reports on Form 10-Q and Current Reports on Form 8-K, which are available at no charge at the SEC’s website, http://www.sec.gov, and our website at https://investors.selectenergy.com/sec-filings. In addition, documents will also be available for free from the Company by contacting the Company at 1233 W Loop S, Suite 1400, Houston, TX 77027 or (713) 235-9500. The contents of the website references in this presentation are not incorporated herein by reference. Non-GAAP Financial Measures Gross profit before depreciation and amortization (“D&A”) and gross margin before D&A are not financial measures presented in accordance with U.S. generally accepted accounting principles (“GAAP”). We define gross profit before D&A as revenue less cost of revenue, excluding cost of sales D&A expense. We define gross margin before D&A as gross profit before D&A divided by revenue. Gross profit before D&A and gross margin before D&A are supplemental non-GAAP financial measures that we believe provide useful information to external users of our financial statements, such as industry analysts, investors, lenders and rating agencies because it allows them to compare our operating performance on a consistent basis across periods by removing the effects of our asset base (such as depreciation and amortization). We present gross profit before D&A and gross margin before D&A because we believe they provide useful information to our investors and market participants regarding the factors and trends affecting our business in addition to measures calculated under GAAP. Gross profit is the GAAP measure most directly comparable to gross profit before D&A. Our non-GAAP financial measures should not be considered as alternatives to the most directly comparable GAAP financial measure. Each of these non-GAAP financial measures has important limitations as an analytical tool due to exclusion of some but not all items that affect the most directly comparable GAAP financial measures. You should not consider gross profit before D&A or gross margin before D&A in isolation or as substitutes for an analysis of our results as reported under GAAP. Because gross profit before D&A or gross margin before D&A may be defined differently by other companies in our industry, our definitions of these non-GAAP financial measures may not be comparable to similarly titled measures of other companies, thereby diminishing their utility. For further discussion, please see our Form 10-K and our latest Quarterly Report on Form 10-Q. For a reconciliation of these non-GAAP measures presented on a historical basis, please see the tables in the Appendix at the end of this presentation.
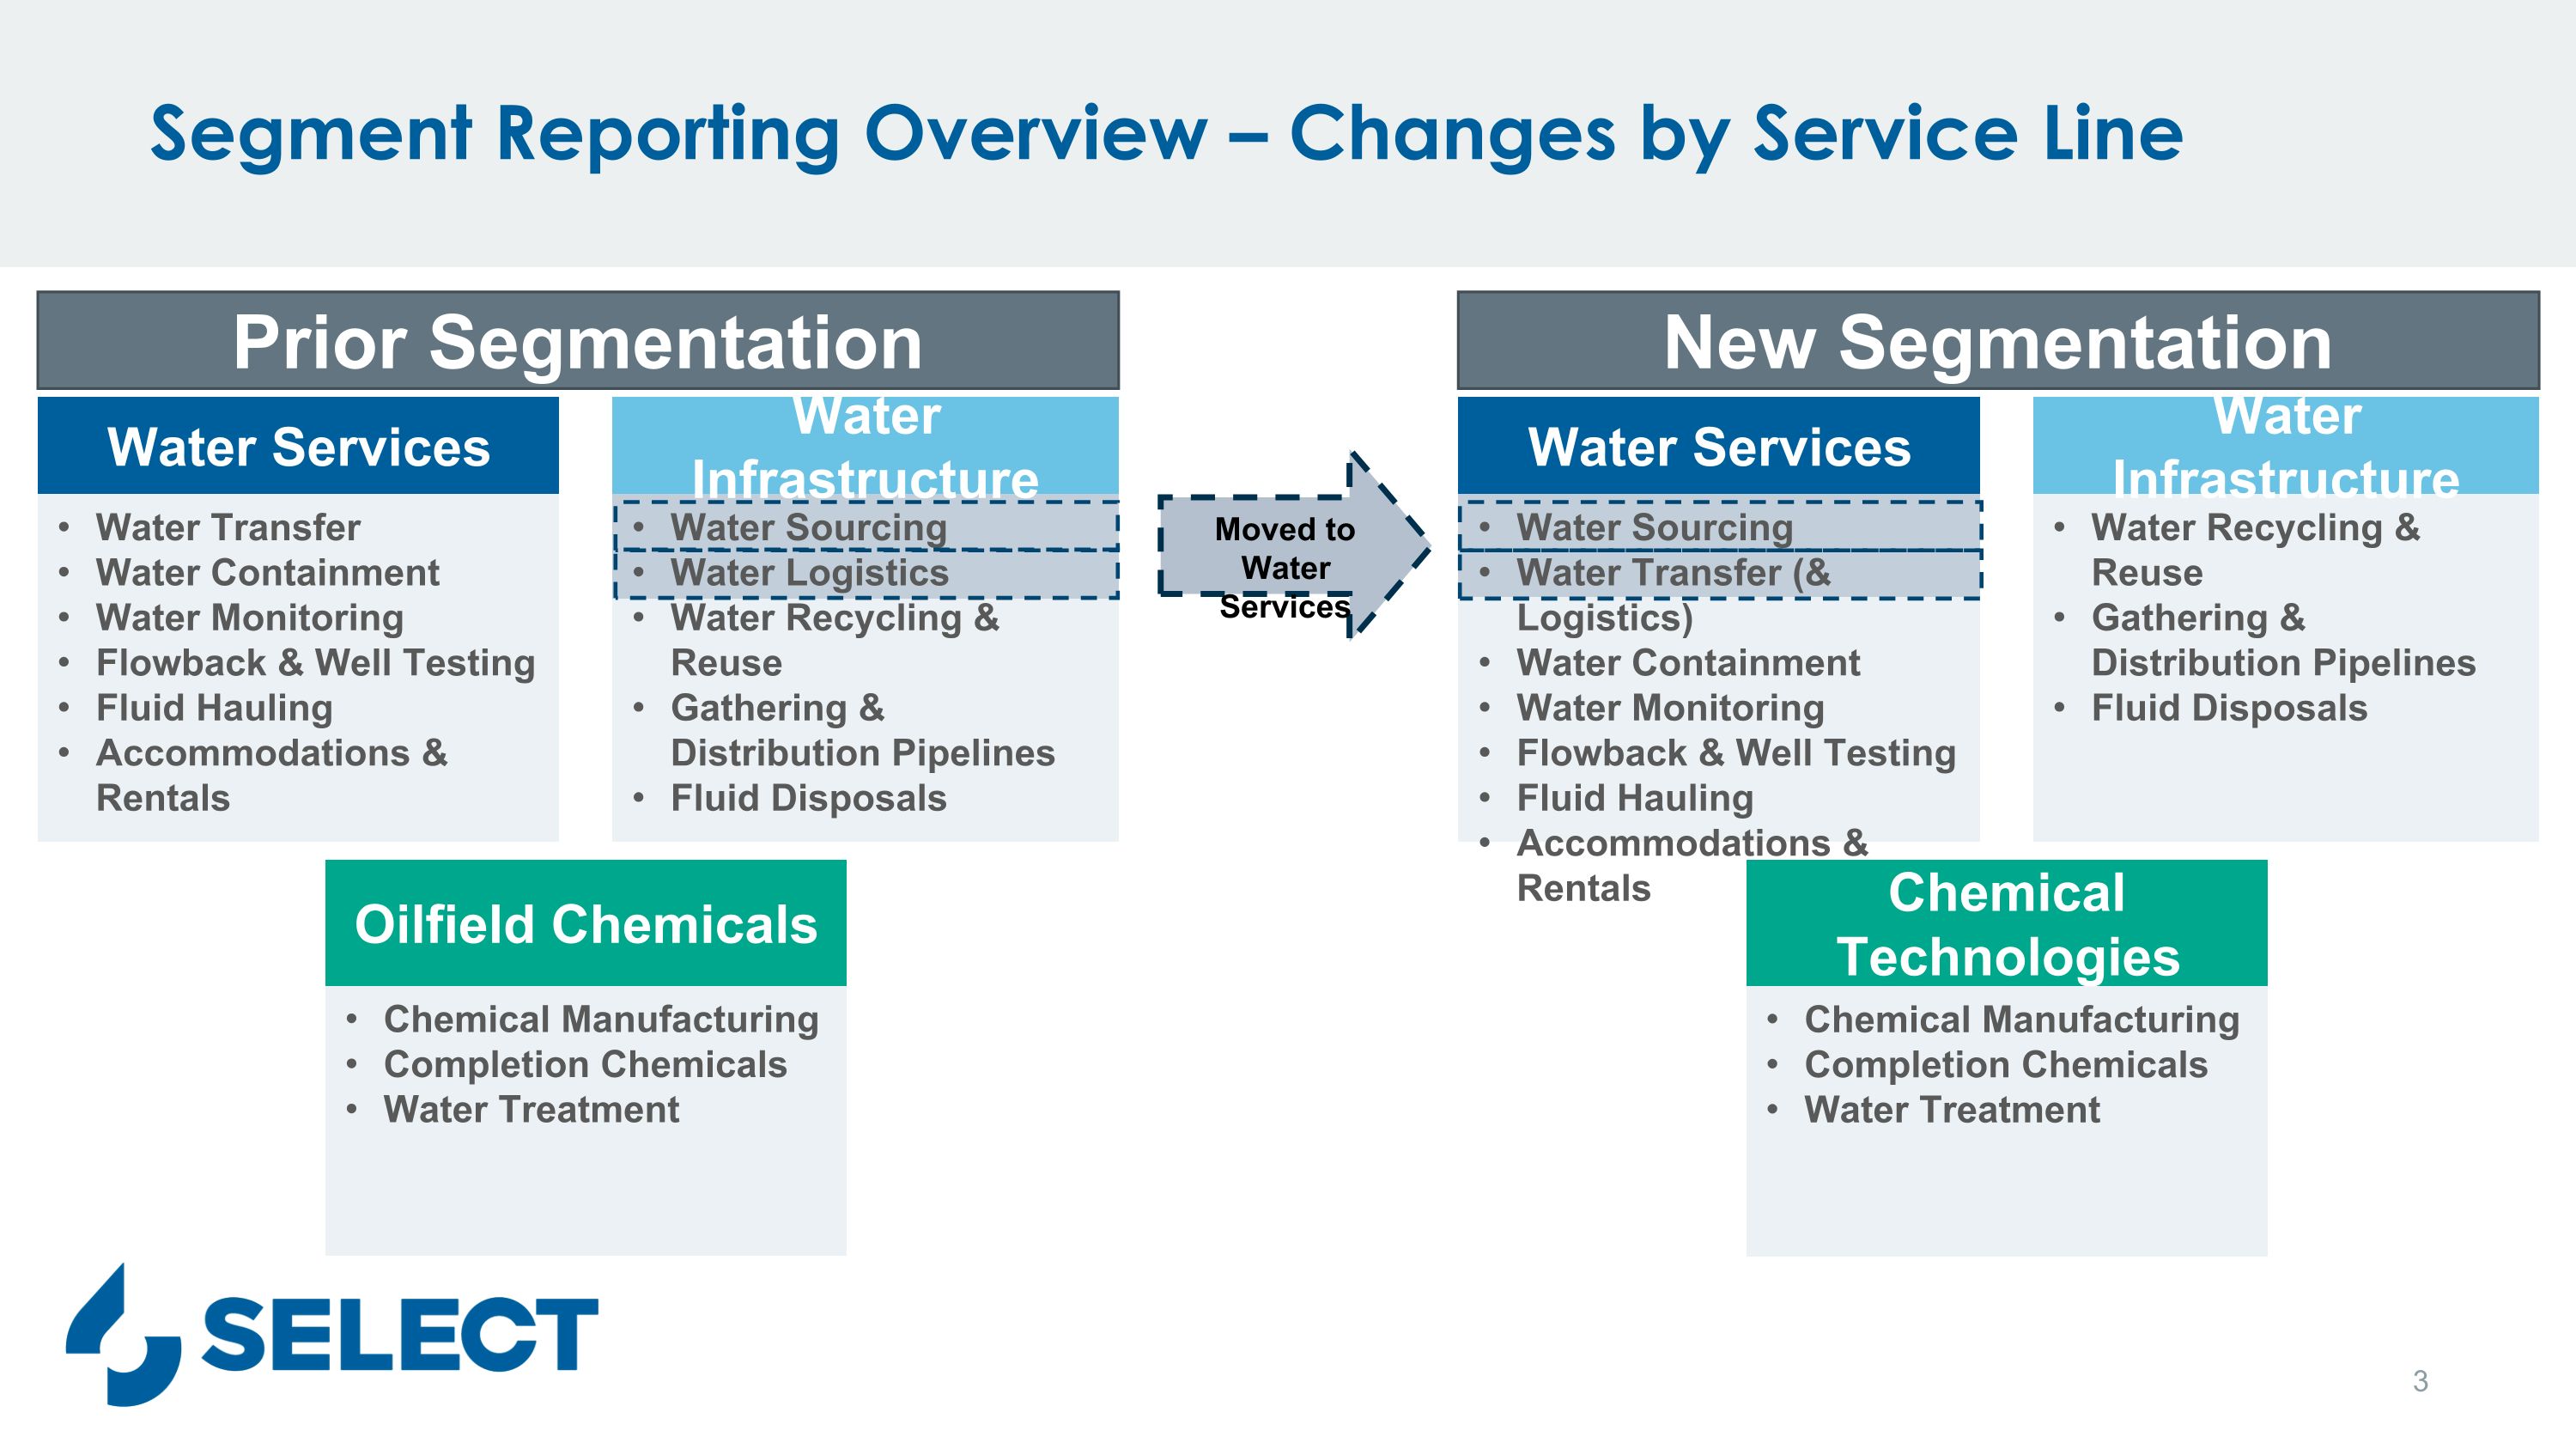
Water Sourcing Water Logistics Water Recycling & Reuse Gathering & Distribution Pipelines Fluid Disposals Segment Reporting Overview – Changes by Service Line Prior Segmentation New Segmentation Water Infrastructure Water Transfer Water Containment Water Monitoring Flowback & Well Testing Fluid Hauling Accommodations & Rentals Water Services Chemical Manufacturing Completion Chemicals Water Treatment Oilfield Chemicals Water Recycling & Reuse Gathering & Distribution Pipelines Fluid Disposals Water Infrastructure Water Sourcing Water Transfer (& Logistics) Water Containment Water Monitoring Flowback & Well Testing Fluid Hauling Accommodations & Rentals Water Services Chemical Manufacturing Completion Chemicals Water Treatment Chemical Technologies Moved to Water Services
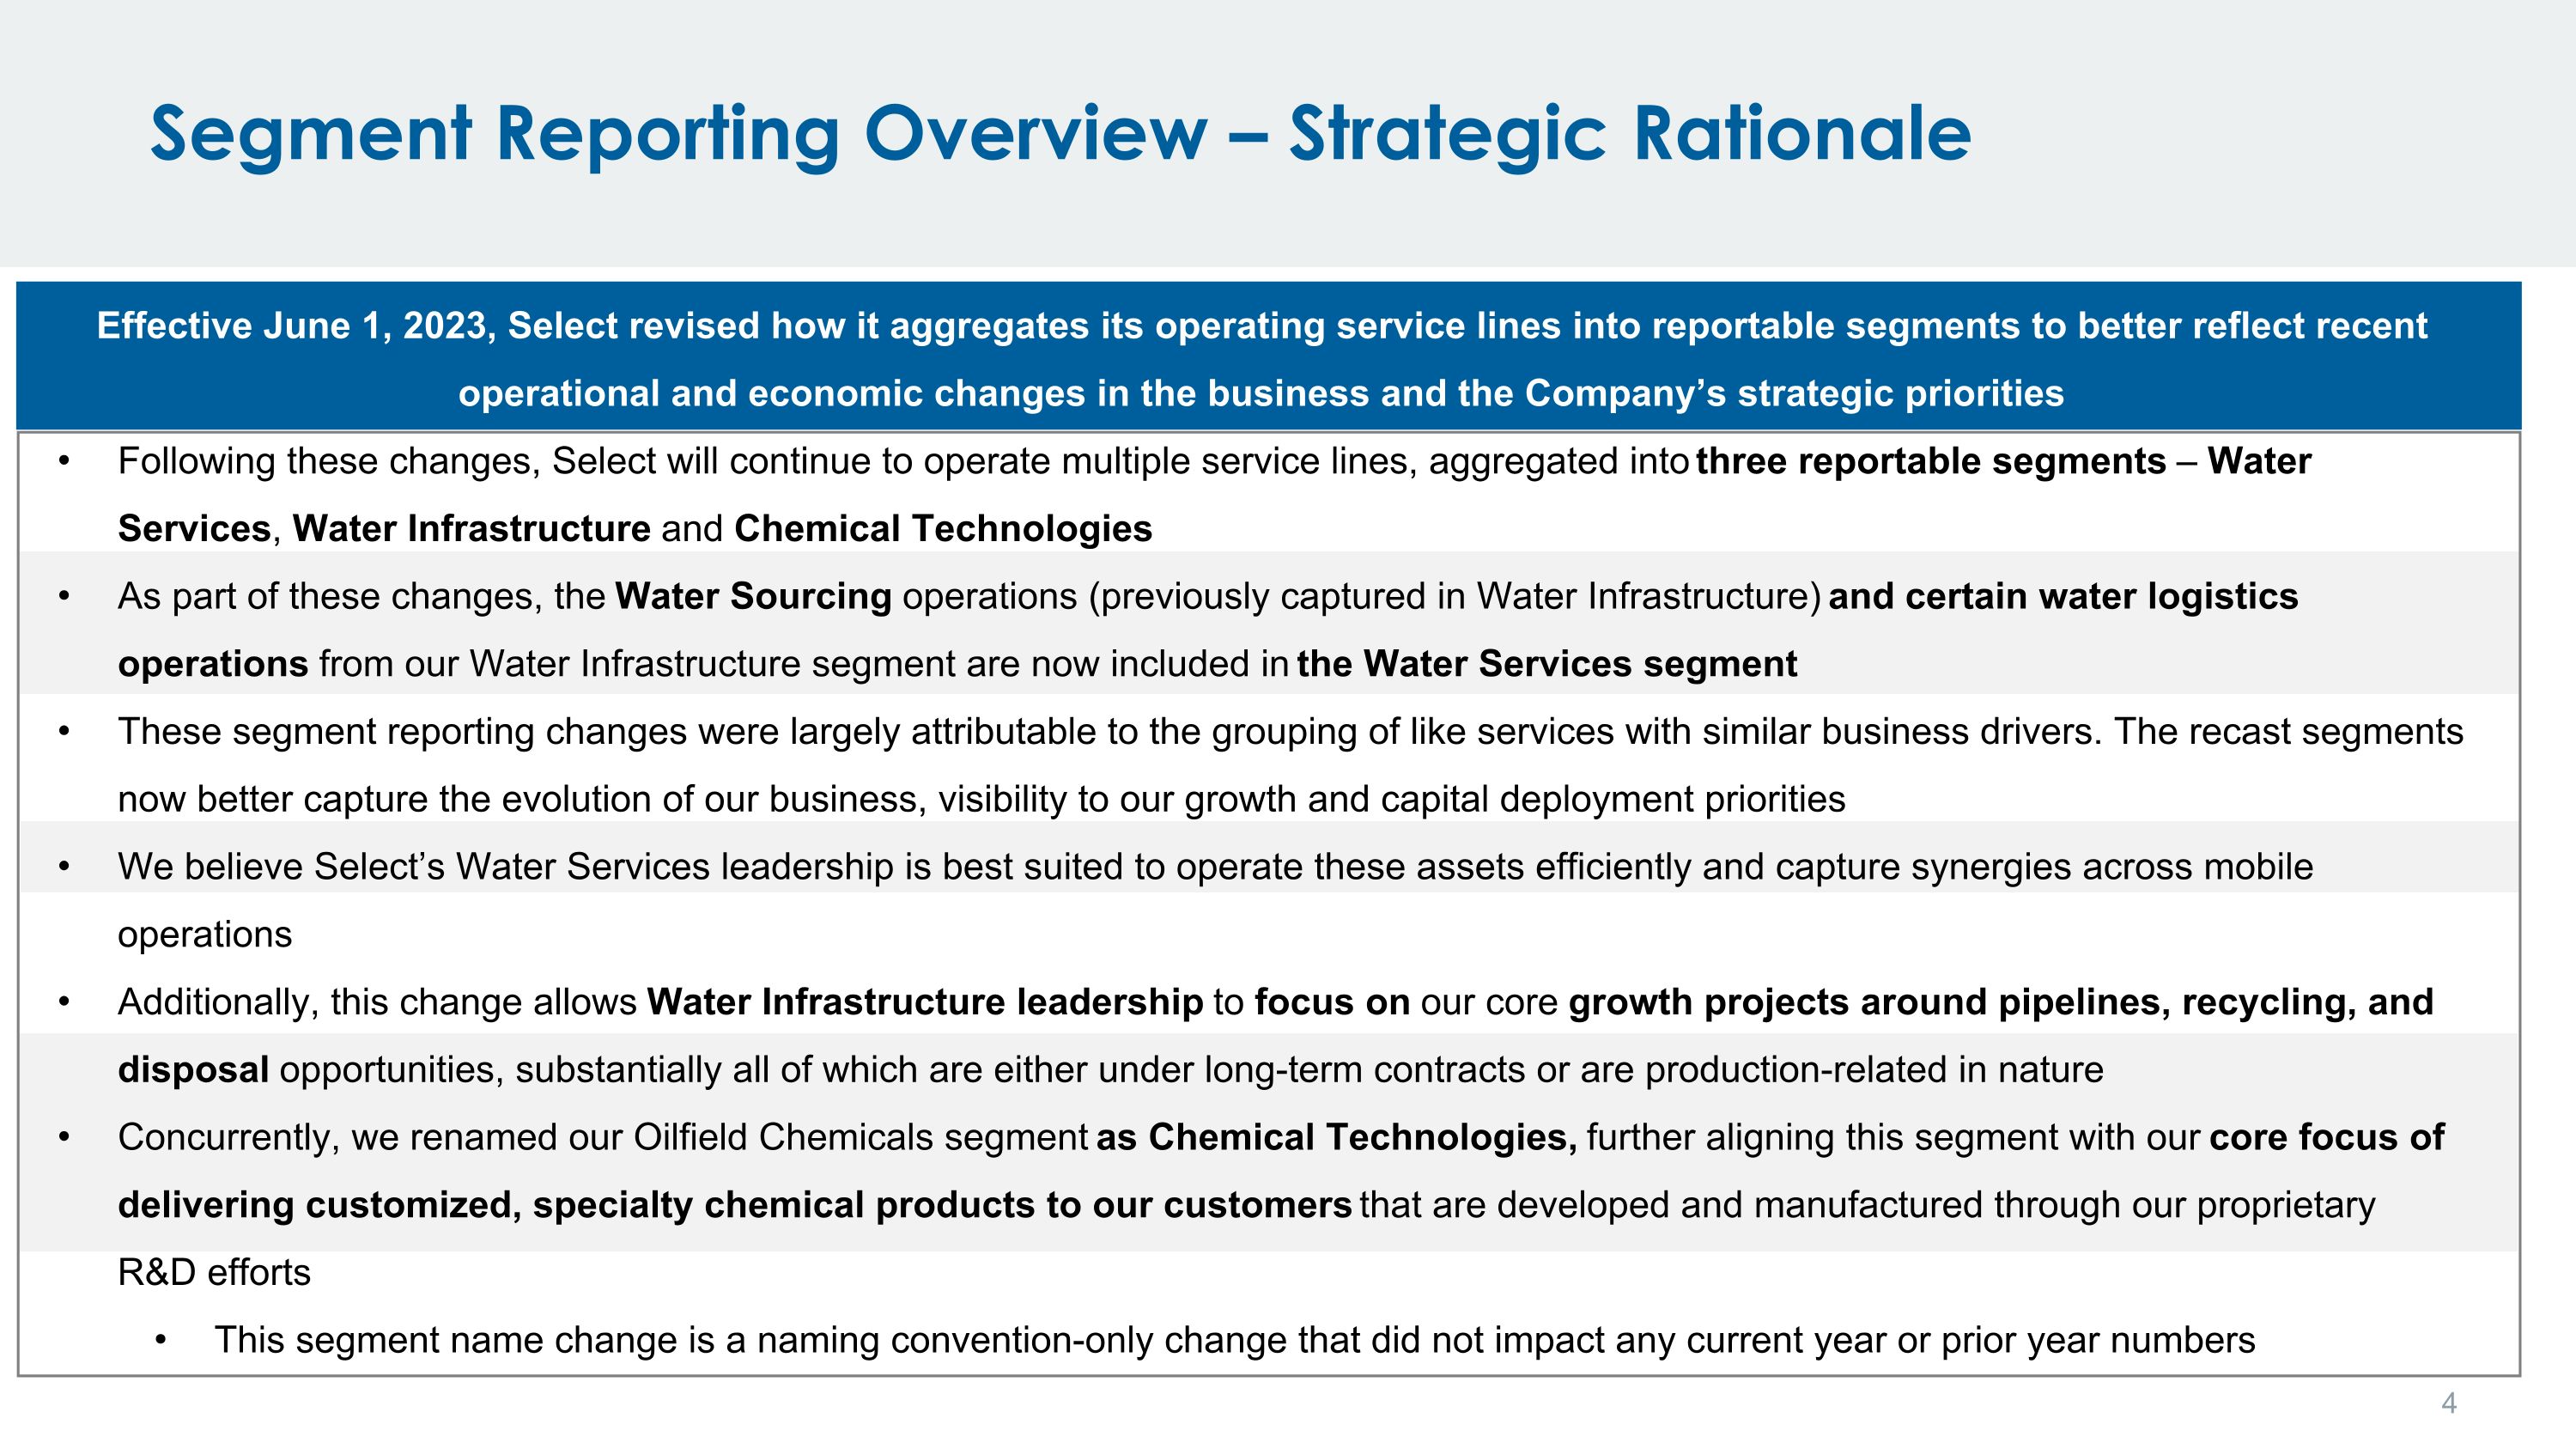
Segment Reporting Overview – Strategic Rationale Effective June 1, 2023, Select revised how it aggregates its operating service lines into reportable segments to better reflect recent operational and economic changes in the business and the Company’s strategic priorities Following these changes, Select will continue to operate multiple service lines, aggregated into three reportable segments – Water Services, Water Infrastructure and Chemical Technologies As part of these changes, the Water Sourcing operations (previously captured in Water Infrastructure) and certain water logistics operations from our Water Infrastructure segment are now included in the Water Services segment These segment reporting changes were largely attributable to the grouping of like services with similar business drivers. The recast segments now better capture the evolution of our business, visibility to our growth and capital deployment priorities We believe Select’s Water Services leadership is best suited to operate these assets efficiently and capture synergies across mobile operations Additionally, this change allows Water Infrastructure leadership to focus on our core growth projects around pipelines, recycling, and disposal opportunities, substantially all of which are either under long-term contracts or are production-related in nature Concurrently, we renamed our Oilfield Chemicals segment as Chemical Technologies, further aligning this segment with our core focus of delivering customized, specialty chemical products to our customers that are developed and manufactured through our proprietary R&D efforts This segment name change is a naming convention-only change that did not impact any current year or prior year numbers
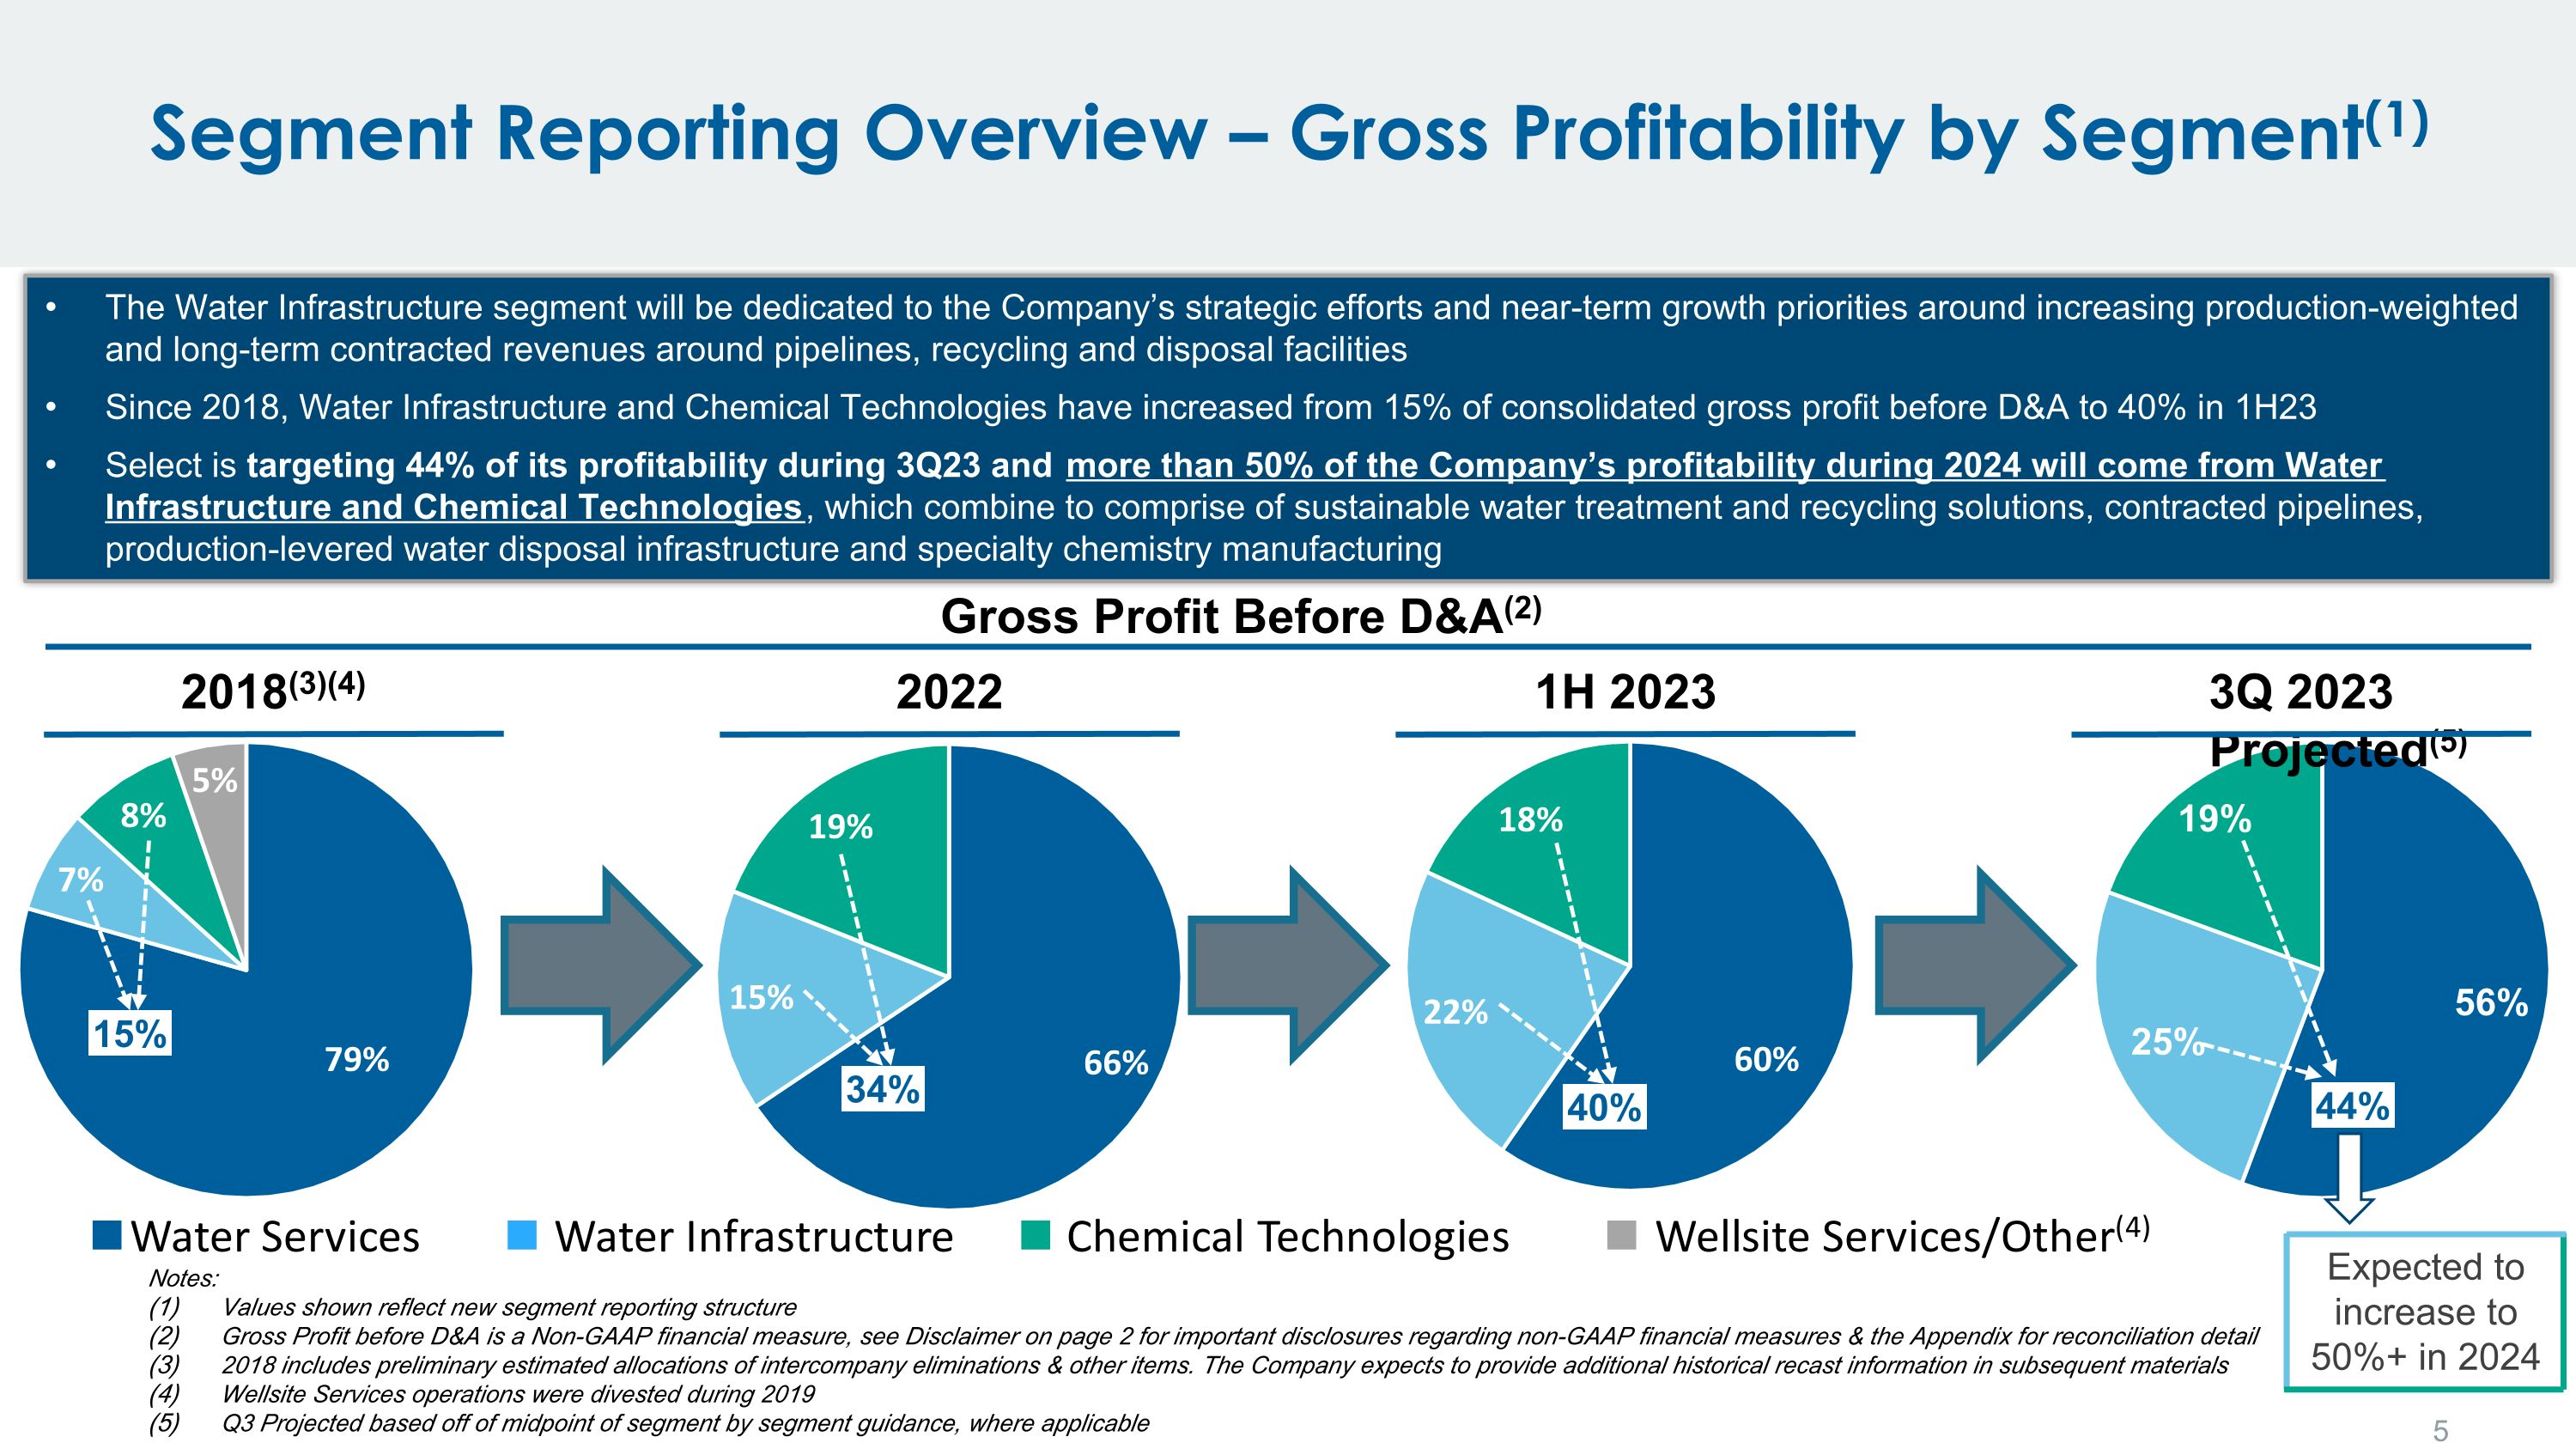
Expected to increase to 50%+ in 2024 Segment Reporting Overview – Gross Profitability by Segment(1) 2018(3)(4) 2022 1H 2023 Notes: Values shown reflect new segment reporting structure Gross Profit before D&A is a Non-GAAP financial measure, see Disclaimer on page 2 for important disclosures regarding non-GAAP financial measures & the Appendix for reconciliation detail 2018 includes preliminary estimated allocations of intercompany eliminations & other items. The Company expects to provide additional historical recast information in subsequent materials Wellsite Services operations were divested during 2019 Q3 Projected based off of midpoint of segment by segment guidance, where applicable The Water Infrastructure segment will be dedicated to the Company’s strategic efforts and near-term growth priorities around increasing production-weighted and long-term contracted revenues around pipelines, recycling and disposal facilities Since 2018, Water Infrastructure and Chemical Technologies have increased from 15% of consolidated gross profit before D&A to 40% in 1H23 Select is targeting 44% of its profitability during 3Q23 and more than 50% of the Company’s profitability during 2024 will come from Water Infrastructure and Chemical Technologies, which combine to comprise of sustainable water treatment and recycling solutions, contracted pipelines, production-levered water disposal infrastructure and specialty chemistry manufacturing 3Q 2023 Projected(5) Gross Profit Before D&A(2) 15% 34% 40% 44%
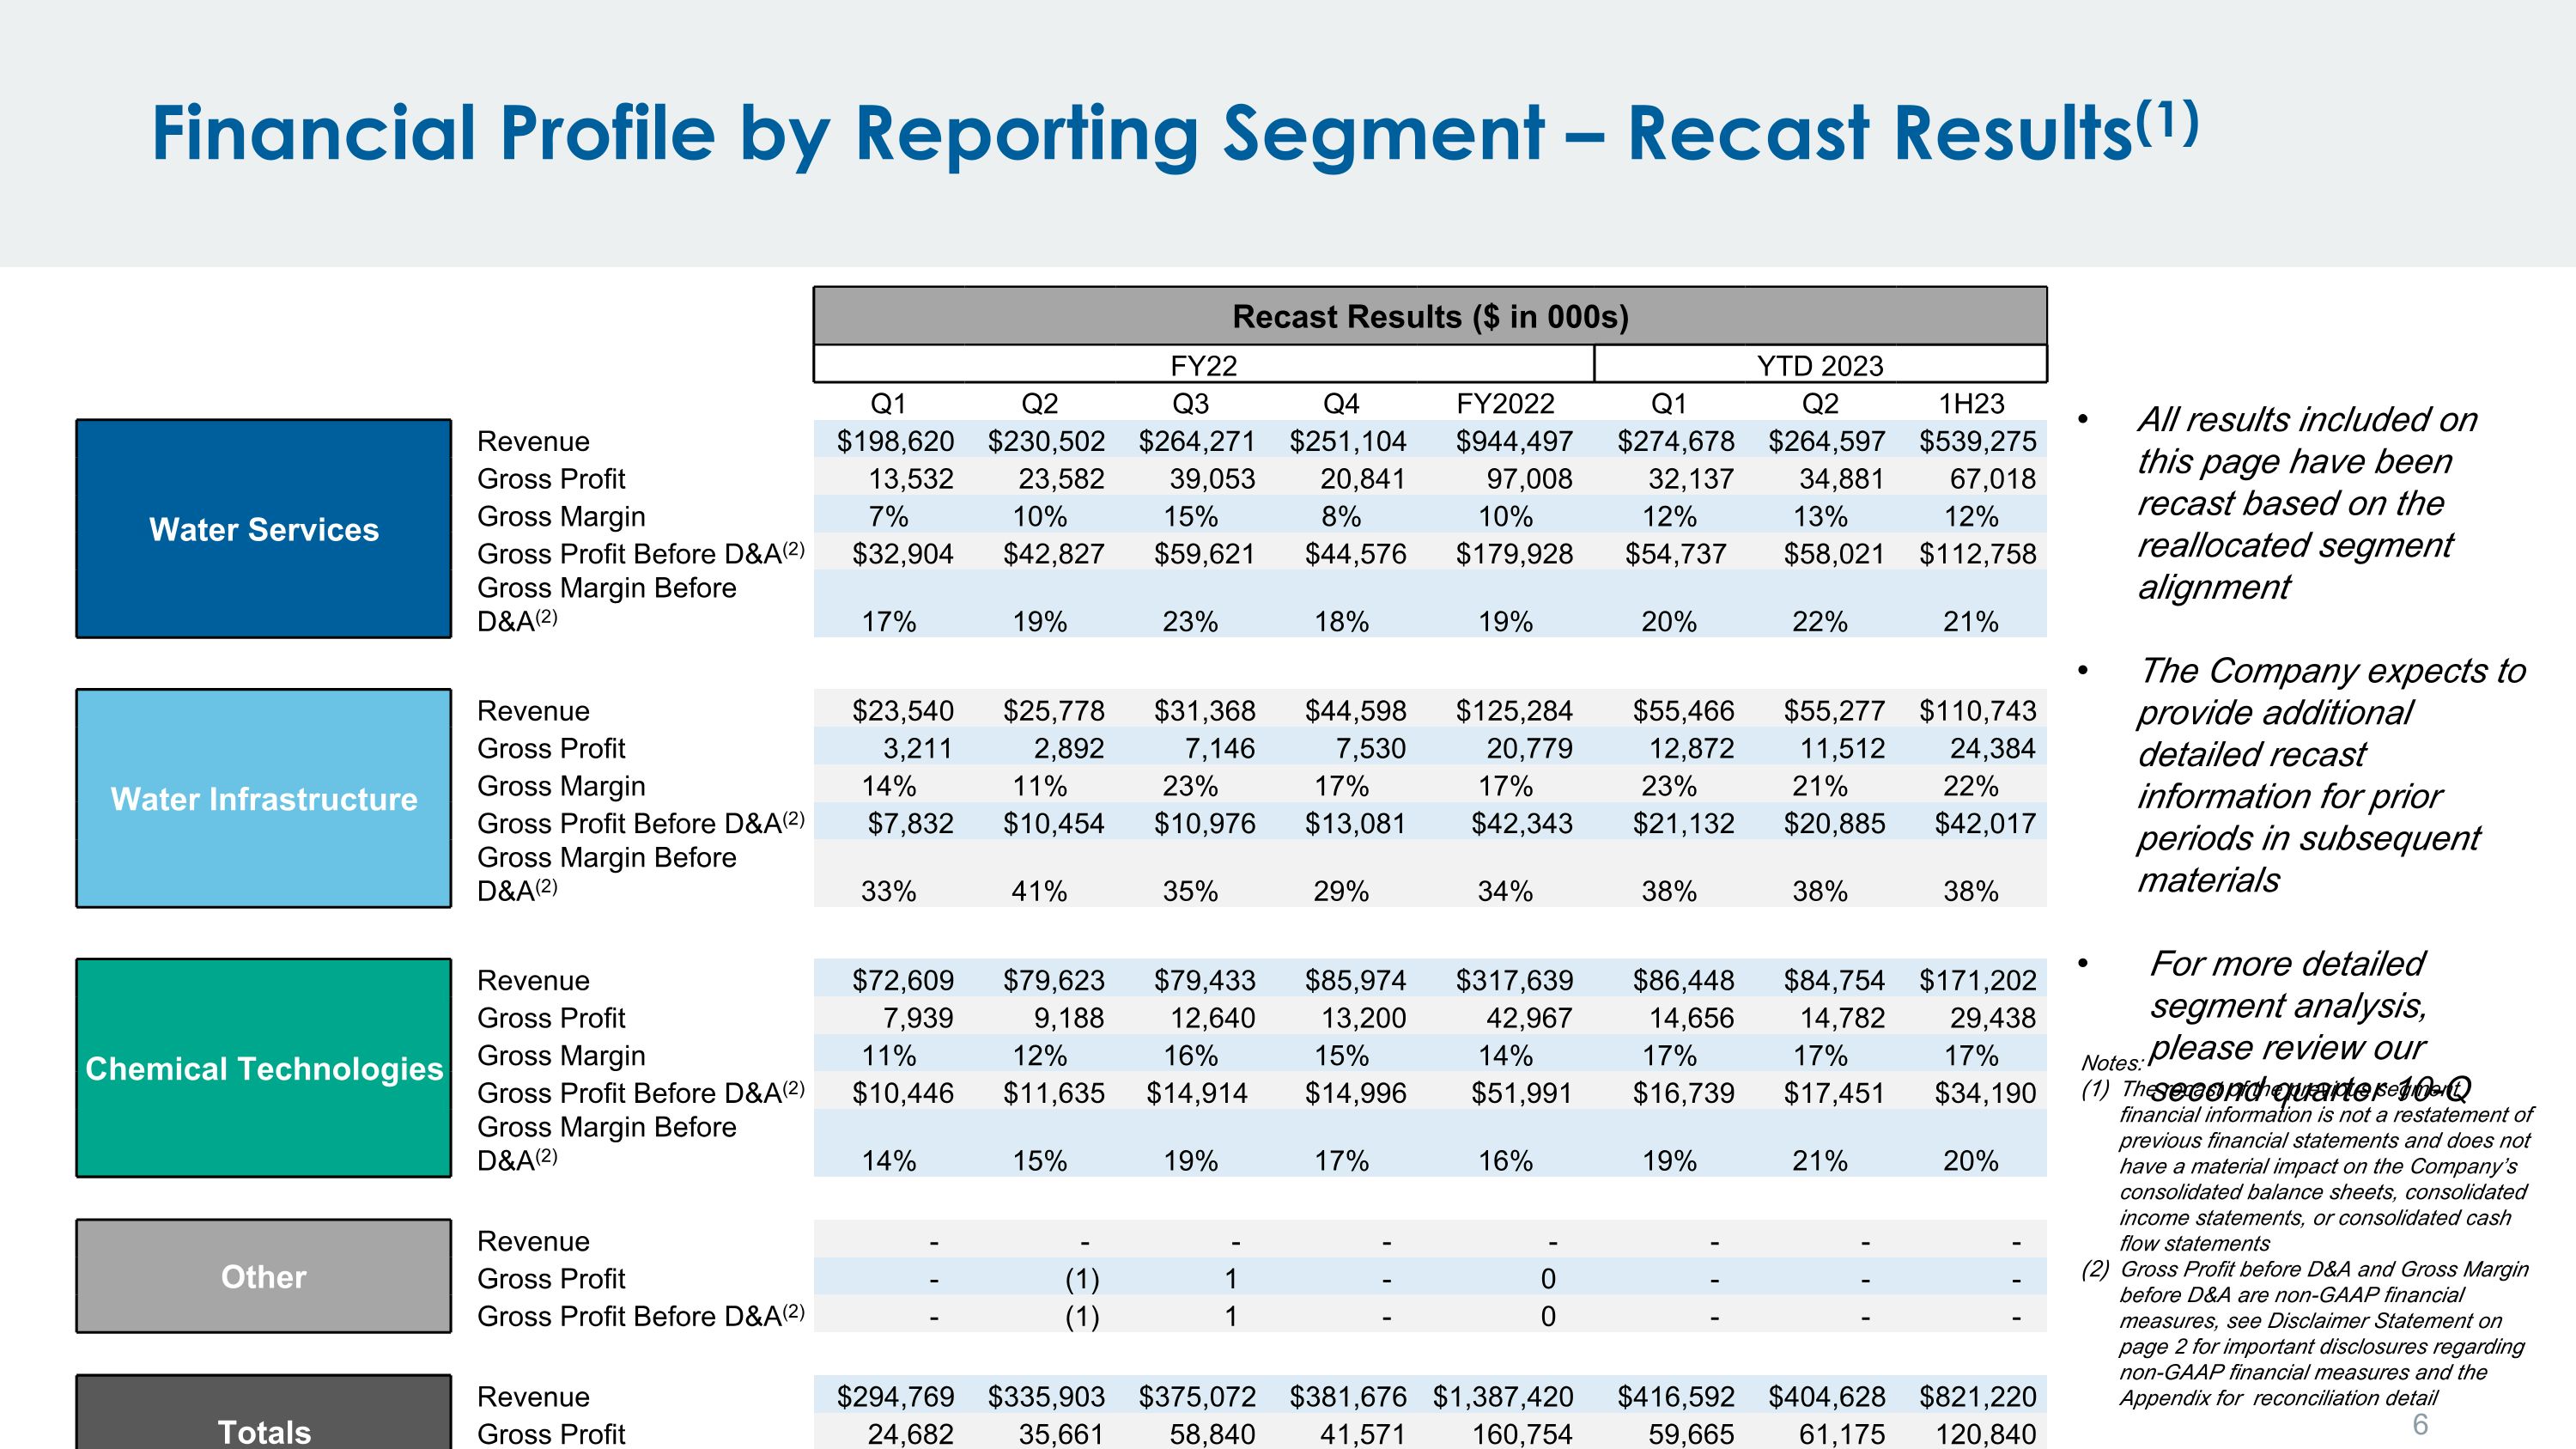
Financial Profile by Reporting Segment – Recast Results(1) Recast Results ($ in 000s) FY22 YTD 2023 Q1 Q2 Q3 Q4 FY2022 Q1 Q2 1H23 Water Services Revenue $198,620 $230,502 $264,271 $251,104 $944,497 $274,678 $264,597 $539,275 Gross Profit 13,532 23,582 39,053 20,841 97,008 32,137 34,881 67,018 Water Services Gross Margin 7% 10% 15% 8% 10% 12% 13% 12% Gross Profit Before D&A(2) $32,904 $42,827 $59,621 $44,576 $179,928 $54,737 $58,021 $112,758 Gross Margin Before D&A(2) 17% 19% 23% 18% 19% 20% 22% 21% Water Infrastructure Revenue $23,540 $25,778 $31,368 $44,598 $125,284 $55,466 $55,277 $110,743 Gross Profit 3,211 2,892 7,146 7,530 20,779 12,872 11,512 24,384 Water Infrastructure Gross Margin 14% 11% 23% 17% 17% 23% 21% 22% Gross Profit Before D&A(2) $7,832 $10,454 $10,976 $13,081 $42,343 $21,132 $20,885 $42,017 Gross Margin Before D&A(2) 33% 41% 35% 29% 34% 38% 38% 38% Chemical Technologies Revenue $72,609 $79,623 $79,433 $85,974 $317,639 $86,448 $84,754 $171,202 Gross Profit 7,939 9,188 12,640 13,200 42,967 14,656 14,782 29,438 Chemical Technologies Gross Margin 11% 12% 16% 15% 14% 17% 17% 17% Gross Profit Before D&A(2) $10,446 $11,635 $14,914 $14,996 $51,991 $16,739 $17,451 $34,190 Gross Margin Before D&A(2) 14% 15% 19% 17% 16% 19% 21% 20% Other Revenue - - - - - - - - Other Gross Profit - (1) 1 - 0 - - - Gross Profit Before D&A(2) - (1) 1 - 0 - - - Totals Revenue $294,769 $335,903 $375,072 $381,676 $1,387,420 $416,592 $404,628 $821,220 Totals Gross Profit 24,682 35,661 58,840 41,571 160,754 59,665 61,175 120,840 Gross Profit Before D&A(2) 51,182 64,915 85,512 72,653 274,262 92,608 96,357 188,965 All results included on this page have been recast based on the reallocated segment alignment The Company expects to provide additional detailed recast information for prior periods in subsequent materials For more detailed segment analysis, please review our second quarter 10-Q Notes: The recast of the previous segment financial information is not a restatement of previous financial statements and does not have a material impact on the Company’s consolidated balance sheets, consolidated income statements, or consolidated cash flow statements Gross Profit before D&A and Gross Margin before D&A are non-GAAP financial measures, see Disclaimer Statement on page 2 for important disclosures regarding non-GAAP financial measures and the Appendix for reconciliation detail
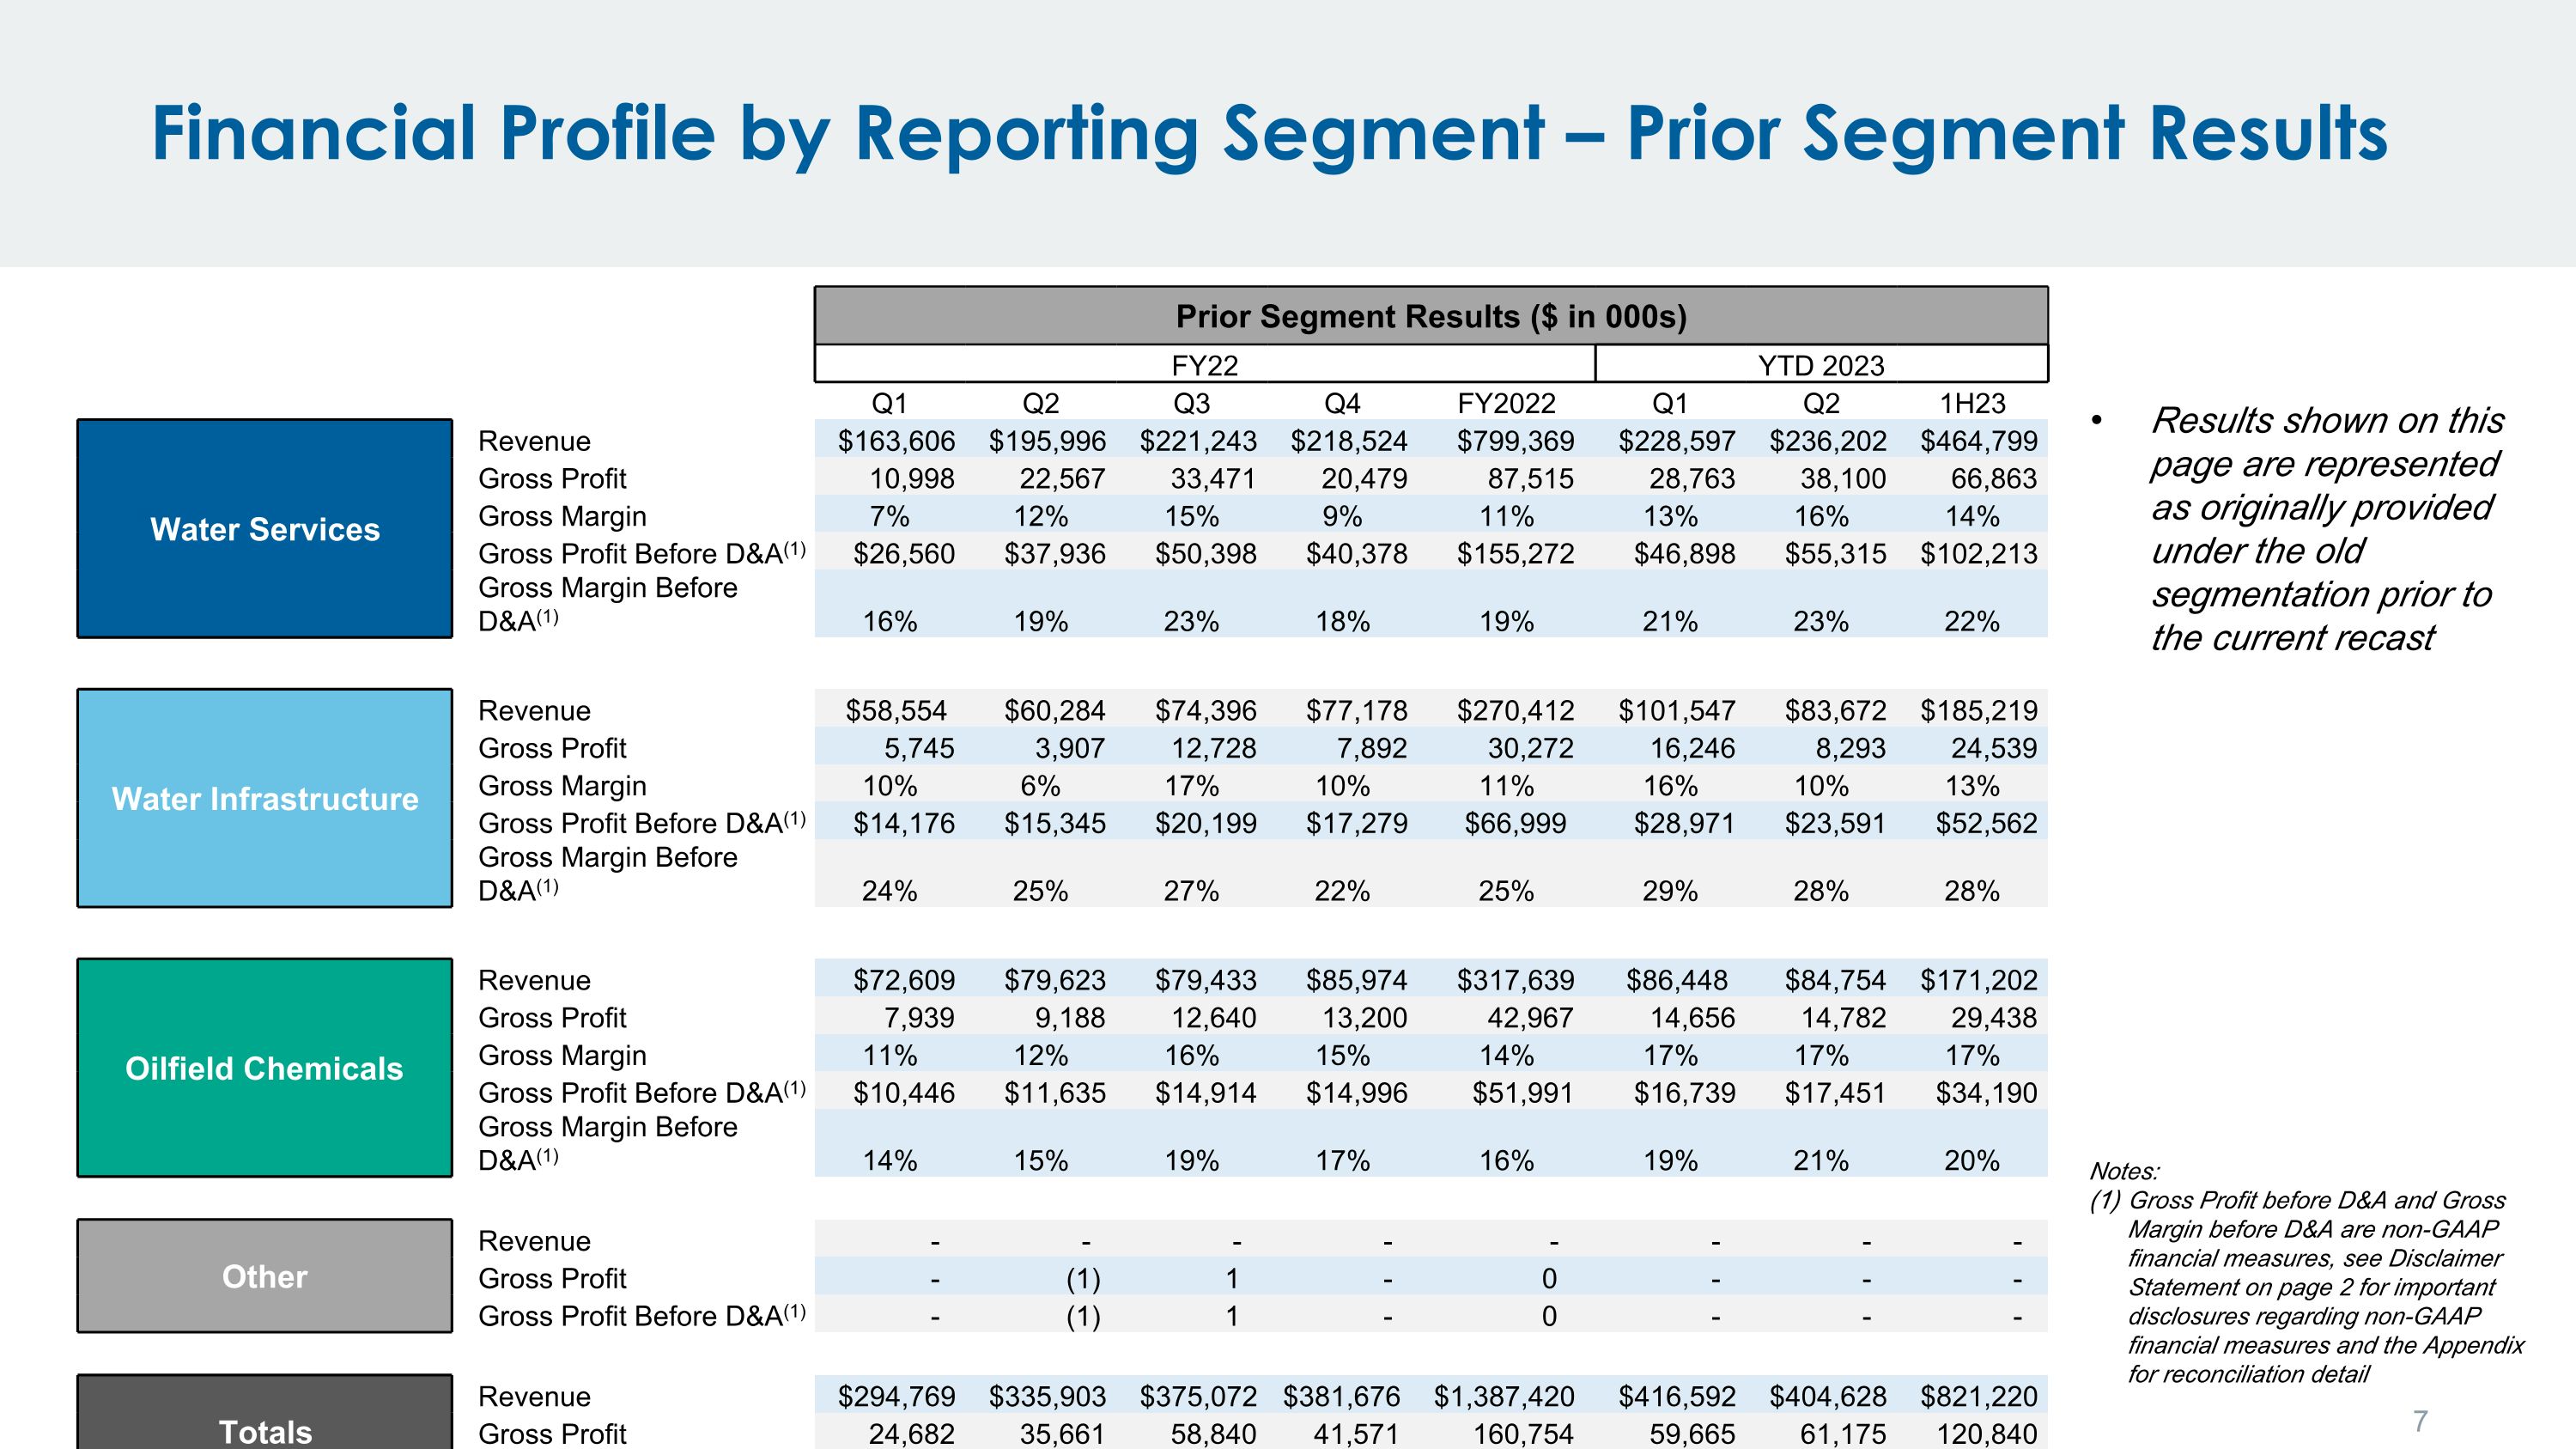
Financial Profile by Reporting Segment – Prior Segment Results Prior Segment Results ($ in 000s) FY22 YTD 2023 Q1 Q2 Q3 Q4 FY2022 Q1 Q2 1H23 Water Services Revenue $163,606 $195,996 $221,243 $218,524 $799,369 $228,597 $236,202 $464,799 Gross Profit 10,998 22,567 33,471 20,479 87,515 28,763 38,100 66,863 Water Services Gross Margin 7% 12% 15% 9% 11% 13% 16% 14% Gross Profit Before D&A(1) $26,560 $37,936 $50,398 $40,378 $155,272 $46,898 $55,315 $102,213 Gross Margin Before D&A(1) 16% 19% 23% 18% 19% 21% 23% 22% Water Infrastructure Revenue $58,554 $60,284 $74,396 $77,178 $270,412 $101,547 $83,672 $185,219 Gross Profit 5,745 3,907 12,728 7,892 30,272 16,246 8,293 24,539 Water Infrastructure Gross Margin 10% 6% 17% 10% 11% 16% 10% 13% Gross Profit Before D&A(1) $14,176 $15,345 $20,199 $17,279 $66,999 $28,971 $23,591 $52,562 Gross Margin Before D&A(1) 24% 25% 27% 22% 25% 29% 28% 28% Oilfield Chemicals Revenue $72,609 $79,623 $79,433 $85,974 $317,639 $86,448 $84,754 $171,202 Gross Profit 7,939 9,188 12,640 13,200 42,967 14,656 14,782 29,438 Chemical Technologies Gross Margin 11% 12% 16% 15% 14% 17% 17% 17% Gross Profit Before D&A(1) $10,446 $11,635 $14,914 $14,996 $51,991 $16,739 $17,451 $34,190 Gross Margin Before D&A(1) 14% 15% 19% 17% 16% 19% 21% 20% Other Revenue - - - - - - - - Other Gross Profit - (1) 1 - 0 - - - Gross Profit Before D&A(1) - (1) 1 - 0 - - - Totals Revenue $294,769 $335,903 $375,072 $381,676 $1,387,420 $416,592 $404,628 $821,220 Totals Gross Profit 24,682 35,661 58,840 41,571 160,754 59,665 61,175 120,840 Gross Profit Before D&A(1) 51,182 64,915 85,512 72,653 274,262 92,608 96,357 188,965 Results shown on this page are represented as originally provided under the old segmentation prior to the current recast Notes: Gross Profit before D&A and Gross Margin before D&A are non-GAAP financial measures, see Disclaimer Statement on page 2 for important disclosures regarding non-GAAP financial measures and the Appendix for reconciliation detail
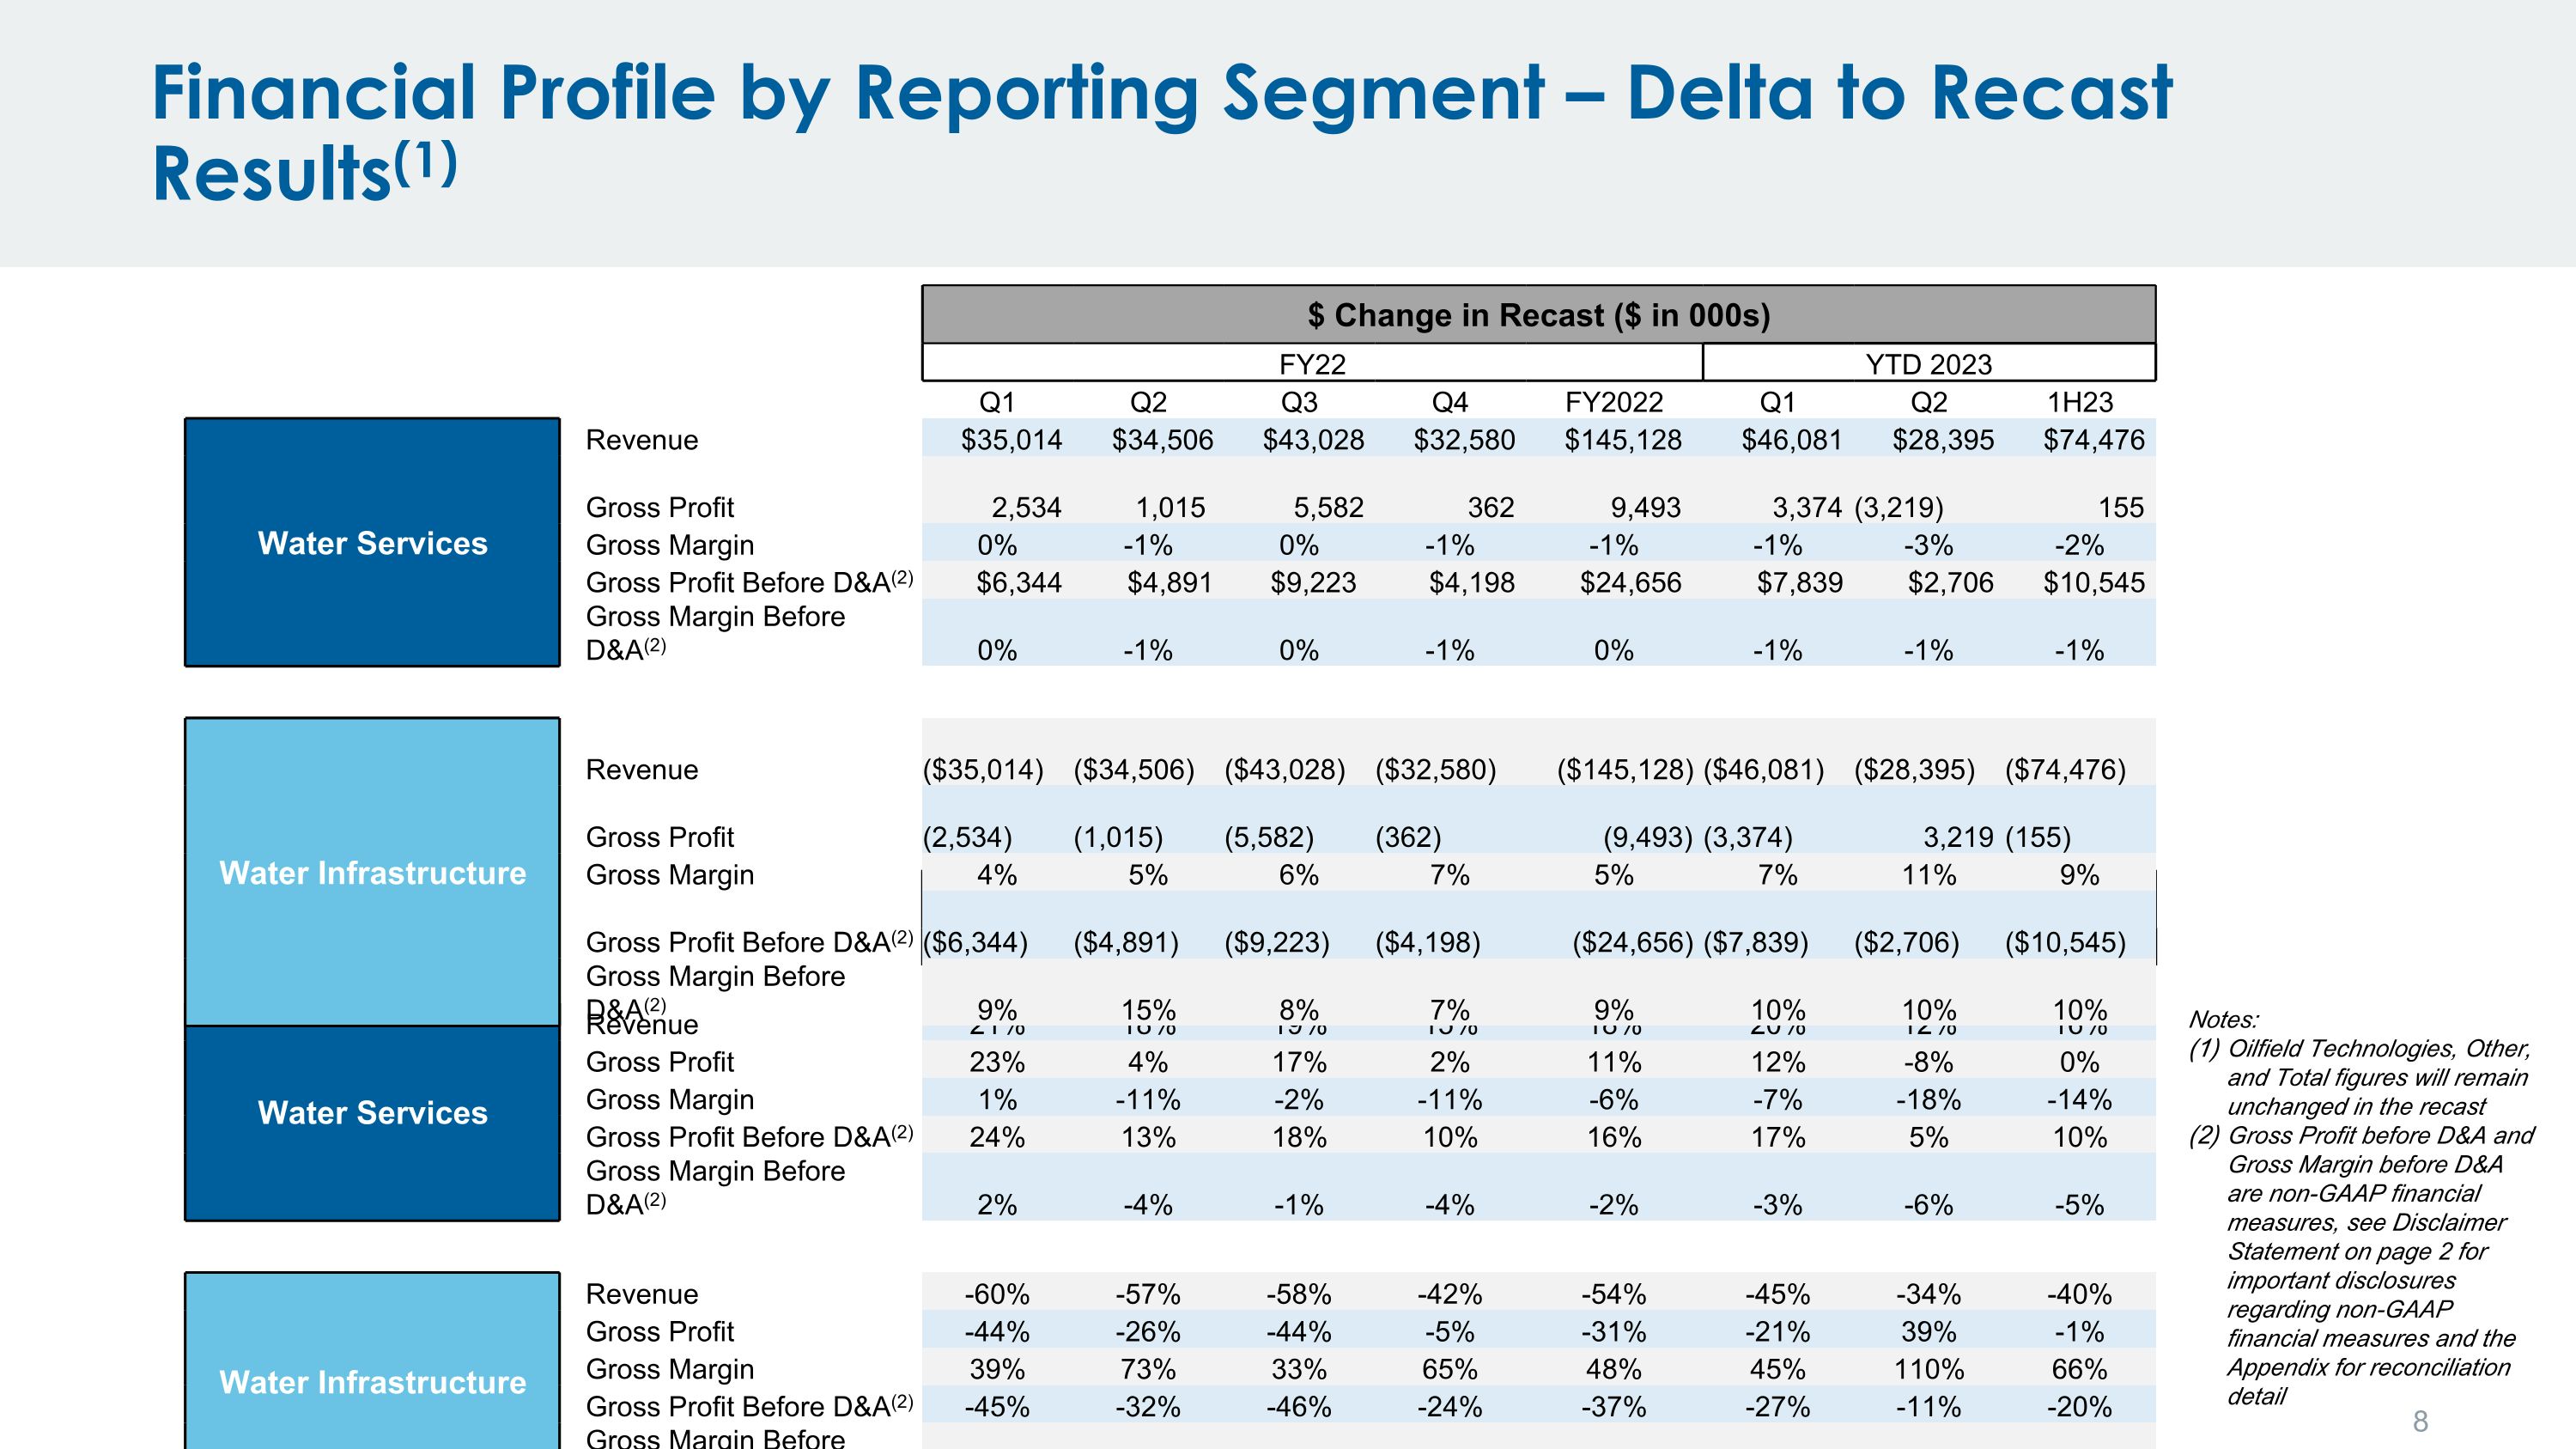
Financial Profile by Reporting Segment – Delta to Recast Results(1) % Change in Recast FY22 YTD 2023 Q1 Q2 Q3 Q4 FY2022 Q1 Q2 1H23 Water Services Revenue 21% 18% 19% 15% 18% 20% 12% 16% Gross Profit 23% 4% 17% 2% 11% 12% -8% 0% Water Services Gross Margin 1% -11% -2% -11% -6% -7% -18% -14% Gross Profit Before D&A(2) 24% 13% 18% 10% 16% 17% 5% 10% Gross Margin Before D&A(2) 2% -4% -1% -4% -2% -3% -6% -5% Water Infrastructure Revenue -60% -57% -58% -42% -54% -45% -34% -40% Gross Profit -44% -26% -44% -5% -31% -21% 39% -1% Water Infrastructure Gross Margin 39% 73% 33% 65% 48% 45% 110% 66% Gross Profit Before D&A(2) -45% -32% -46% -24% -37% -27% -11% -20% Gross Margin Before D&A(2) 37% 59% 29% 31% 36% 34% 34% 34% Notes: Oilfield Technologies, Other, and Total figures will remain unchanged in the recast Gross Profit before D&A and Gross Margin before D&A are non-GAAP financial measures, see Disclaimer Statement on page 2 for important disclosures regarding non-GAAP financial measures and the Appendix for reconciliation detail $ Change in Recast ($ in 000s) FY22 YTD 2023 Q1 Q2 Q3 Q4 FY2022 Q1 Q2 1H23 Water Services Revenue $35,014 $34,506 $43,028 $32,580 $145,128 $46,081 $28,395 $74,476 Gross Profit 2,534 1,015 5,582 362 9,493 3,374 (3,219) 155 Water Services Gross Margin 0% -1% 0% -1% -1% -1% -3% -2% Gross Profit Before D&A(2) $6,344 $4,891 $9,223 $4,198 $24,656 $7,839 $2,706 $10,545 Gross Margin Before D&A(2) 0% -1% 0% -1% 0% -1% -1% -1% Water Infrastructure Revenue ($35,014) ($34,506) ($43,028) ($32,580) ($145,128) ($46,081) ($28,395) ($74,476) Gross Profit (2,534) (1,015) (5,582) (362) (9,493) (3,374) 3,219 (155) Water Infrastructure Gross Margin 4% 5% 6% 7% 5% 7% 11% 9% Gross Profit Before D&A(2) ($6,344) ($4,891) ($9,223) ($4,198) ($24,656) ($7,839) ($2,706) ($10,545) Gross Margin Before D&A(2) 9% 15% 8% 7% 9% 10% 10% 10%
Changes to Segment Reporting & Recast Financial Information Questions regarding Select’s Changes to Segment Reporting & Recast Financial Information can be directed to: Chris George Senior Vice President – Corporate Development, Investor Relations & Sustainability 1233 W Loop S, Suite 1400 | Houston, TX 77027 713-296-1073 cgeorge@selectwater.com
Appendix
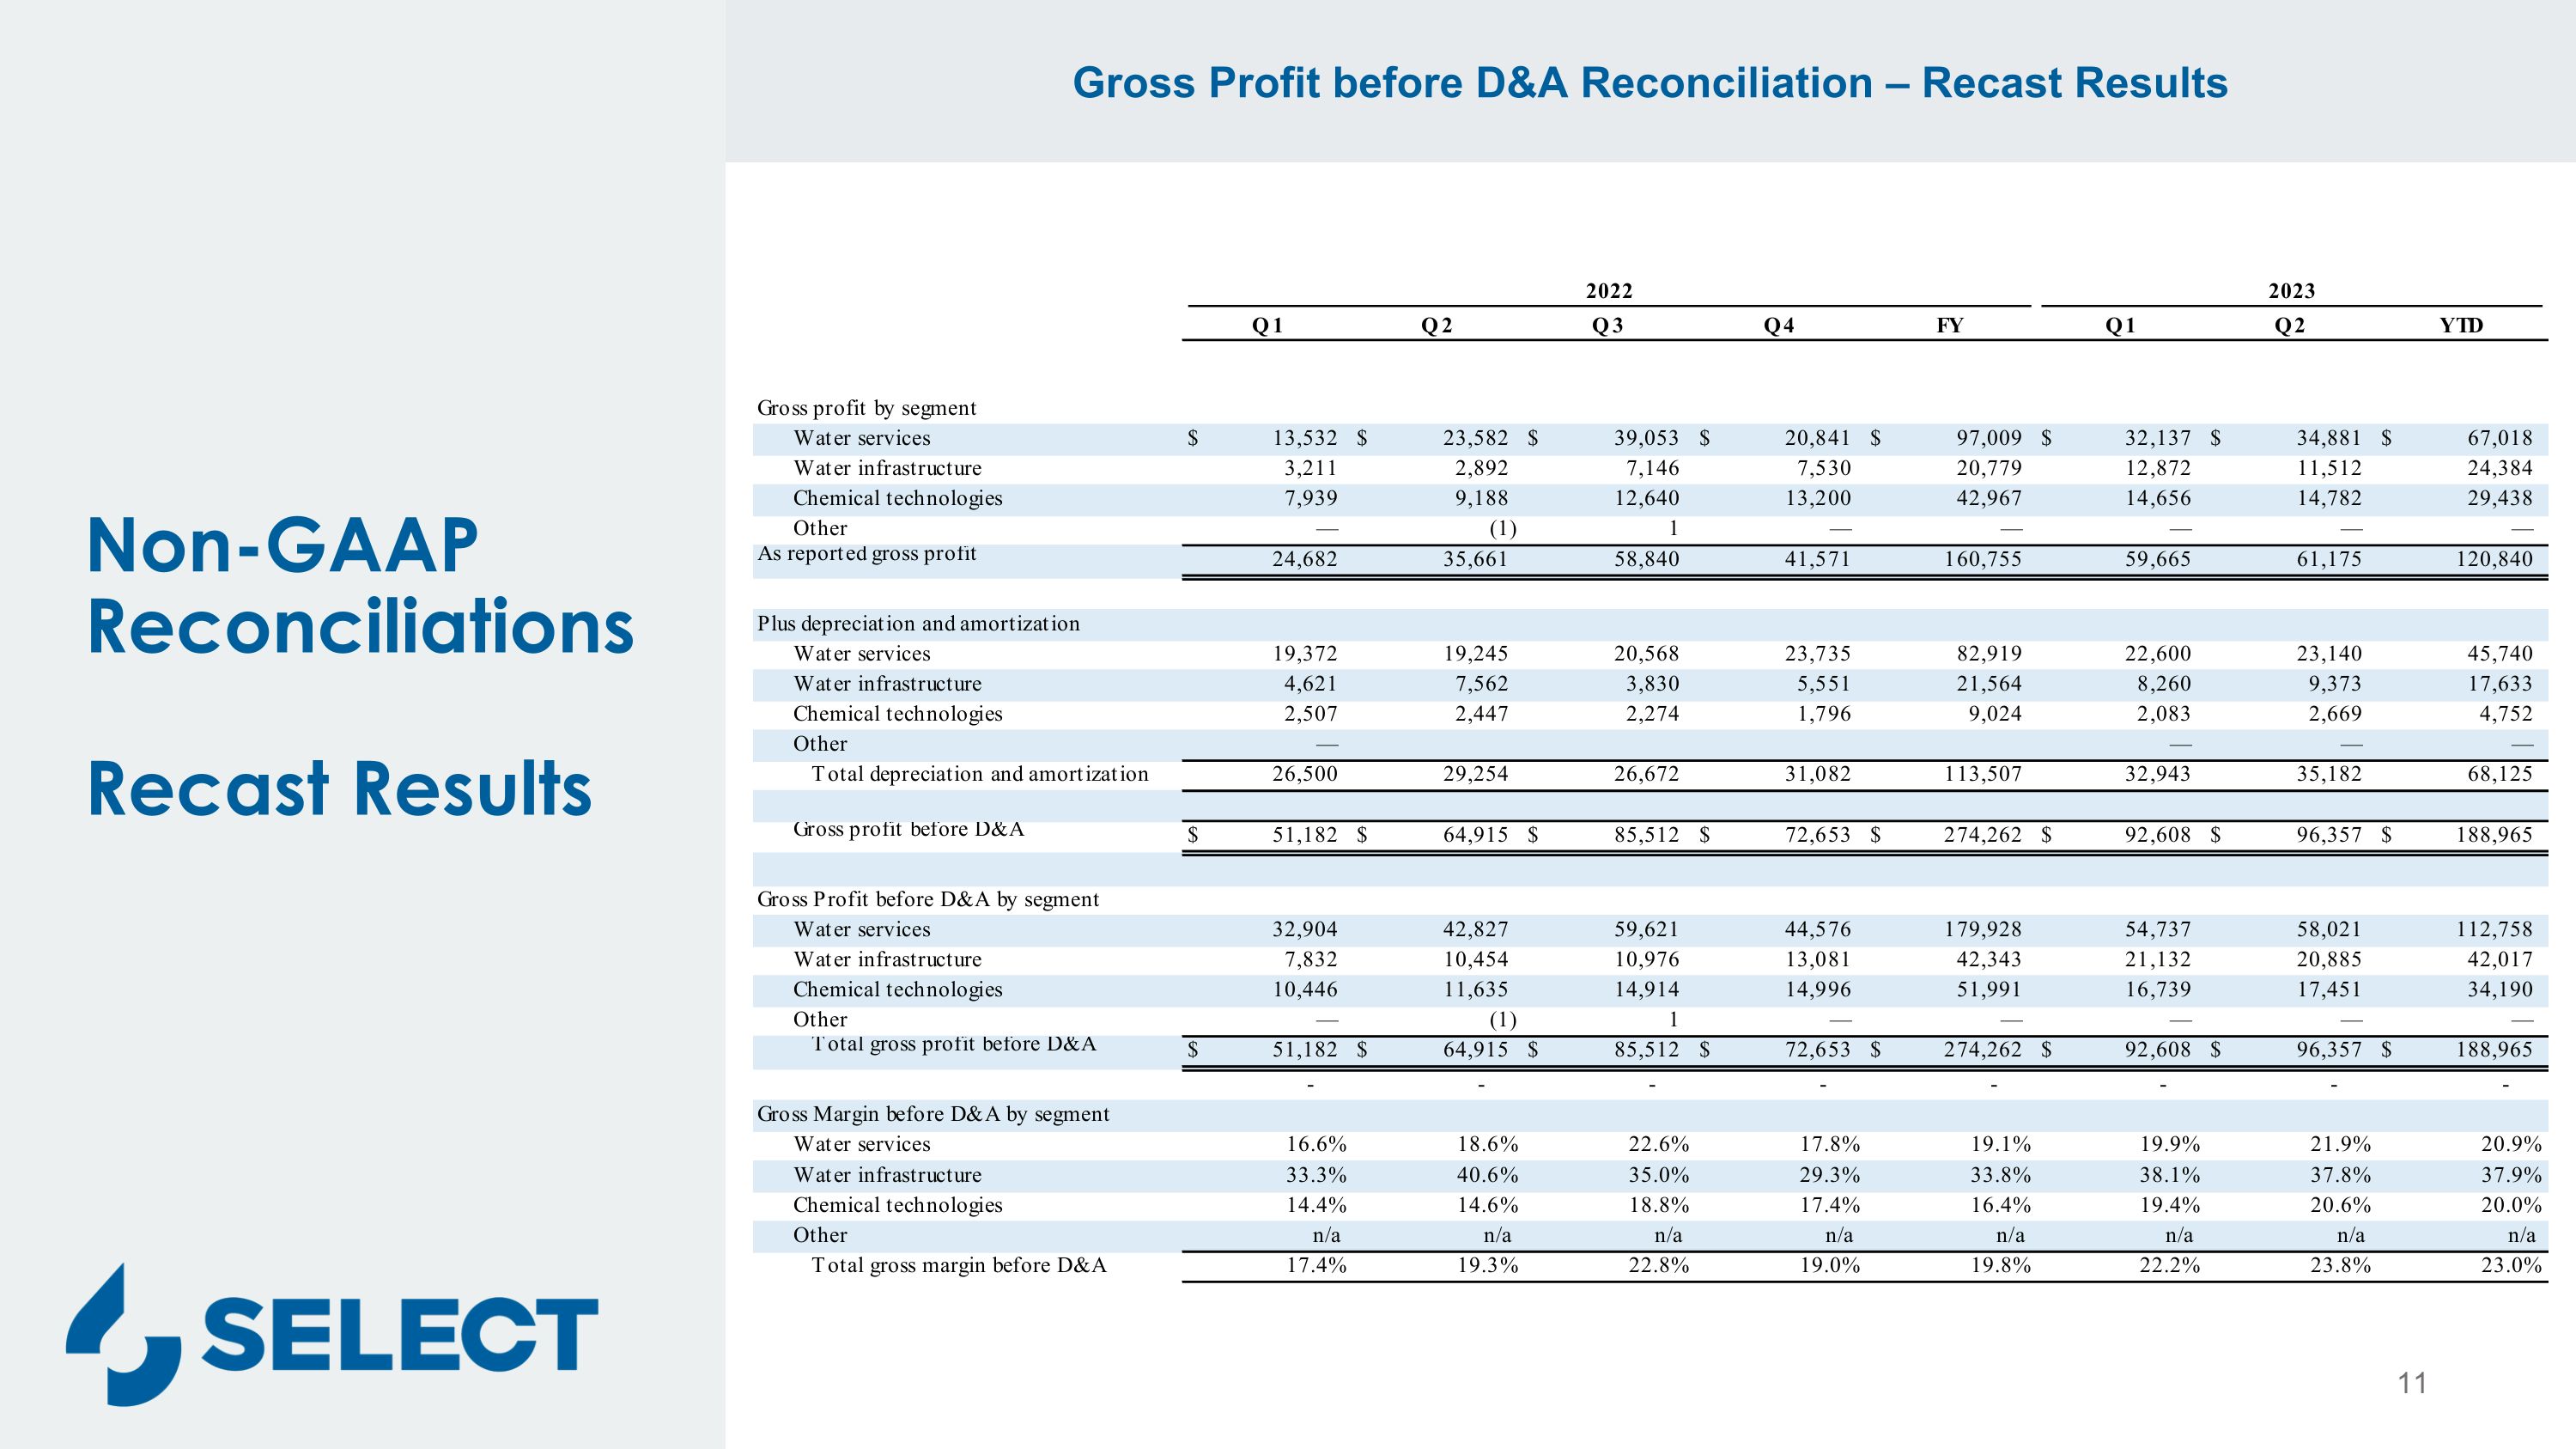
Non-GAAP ReconciliationsRecast Results Gross Profit before D&A Reconciliation – Recast Results 11
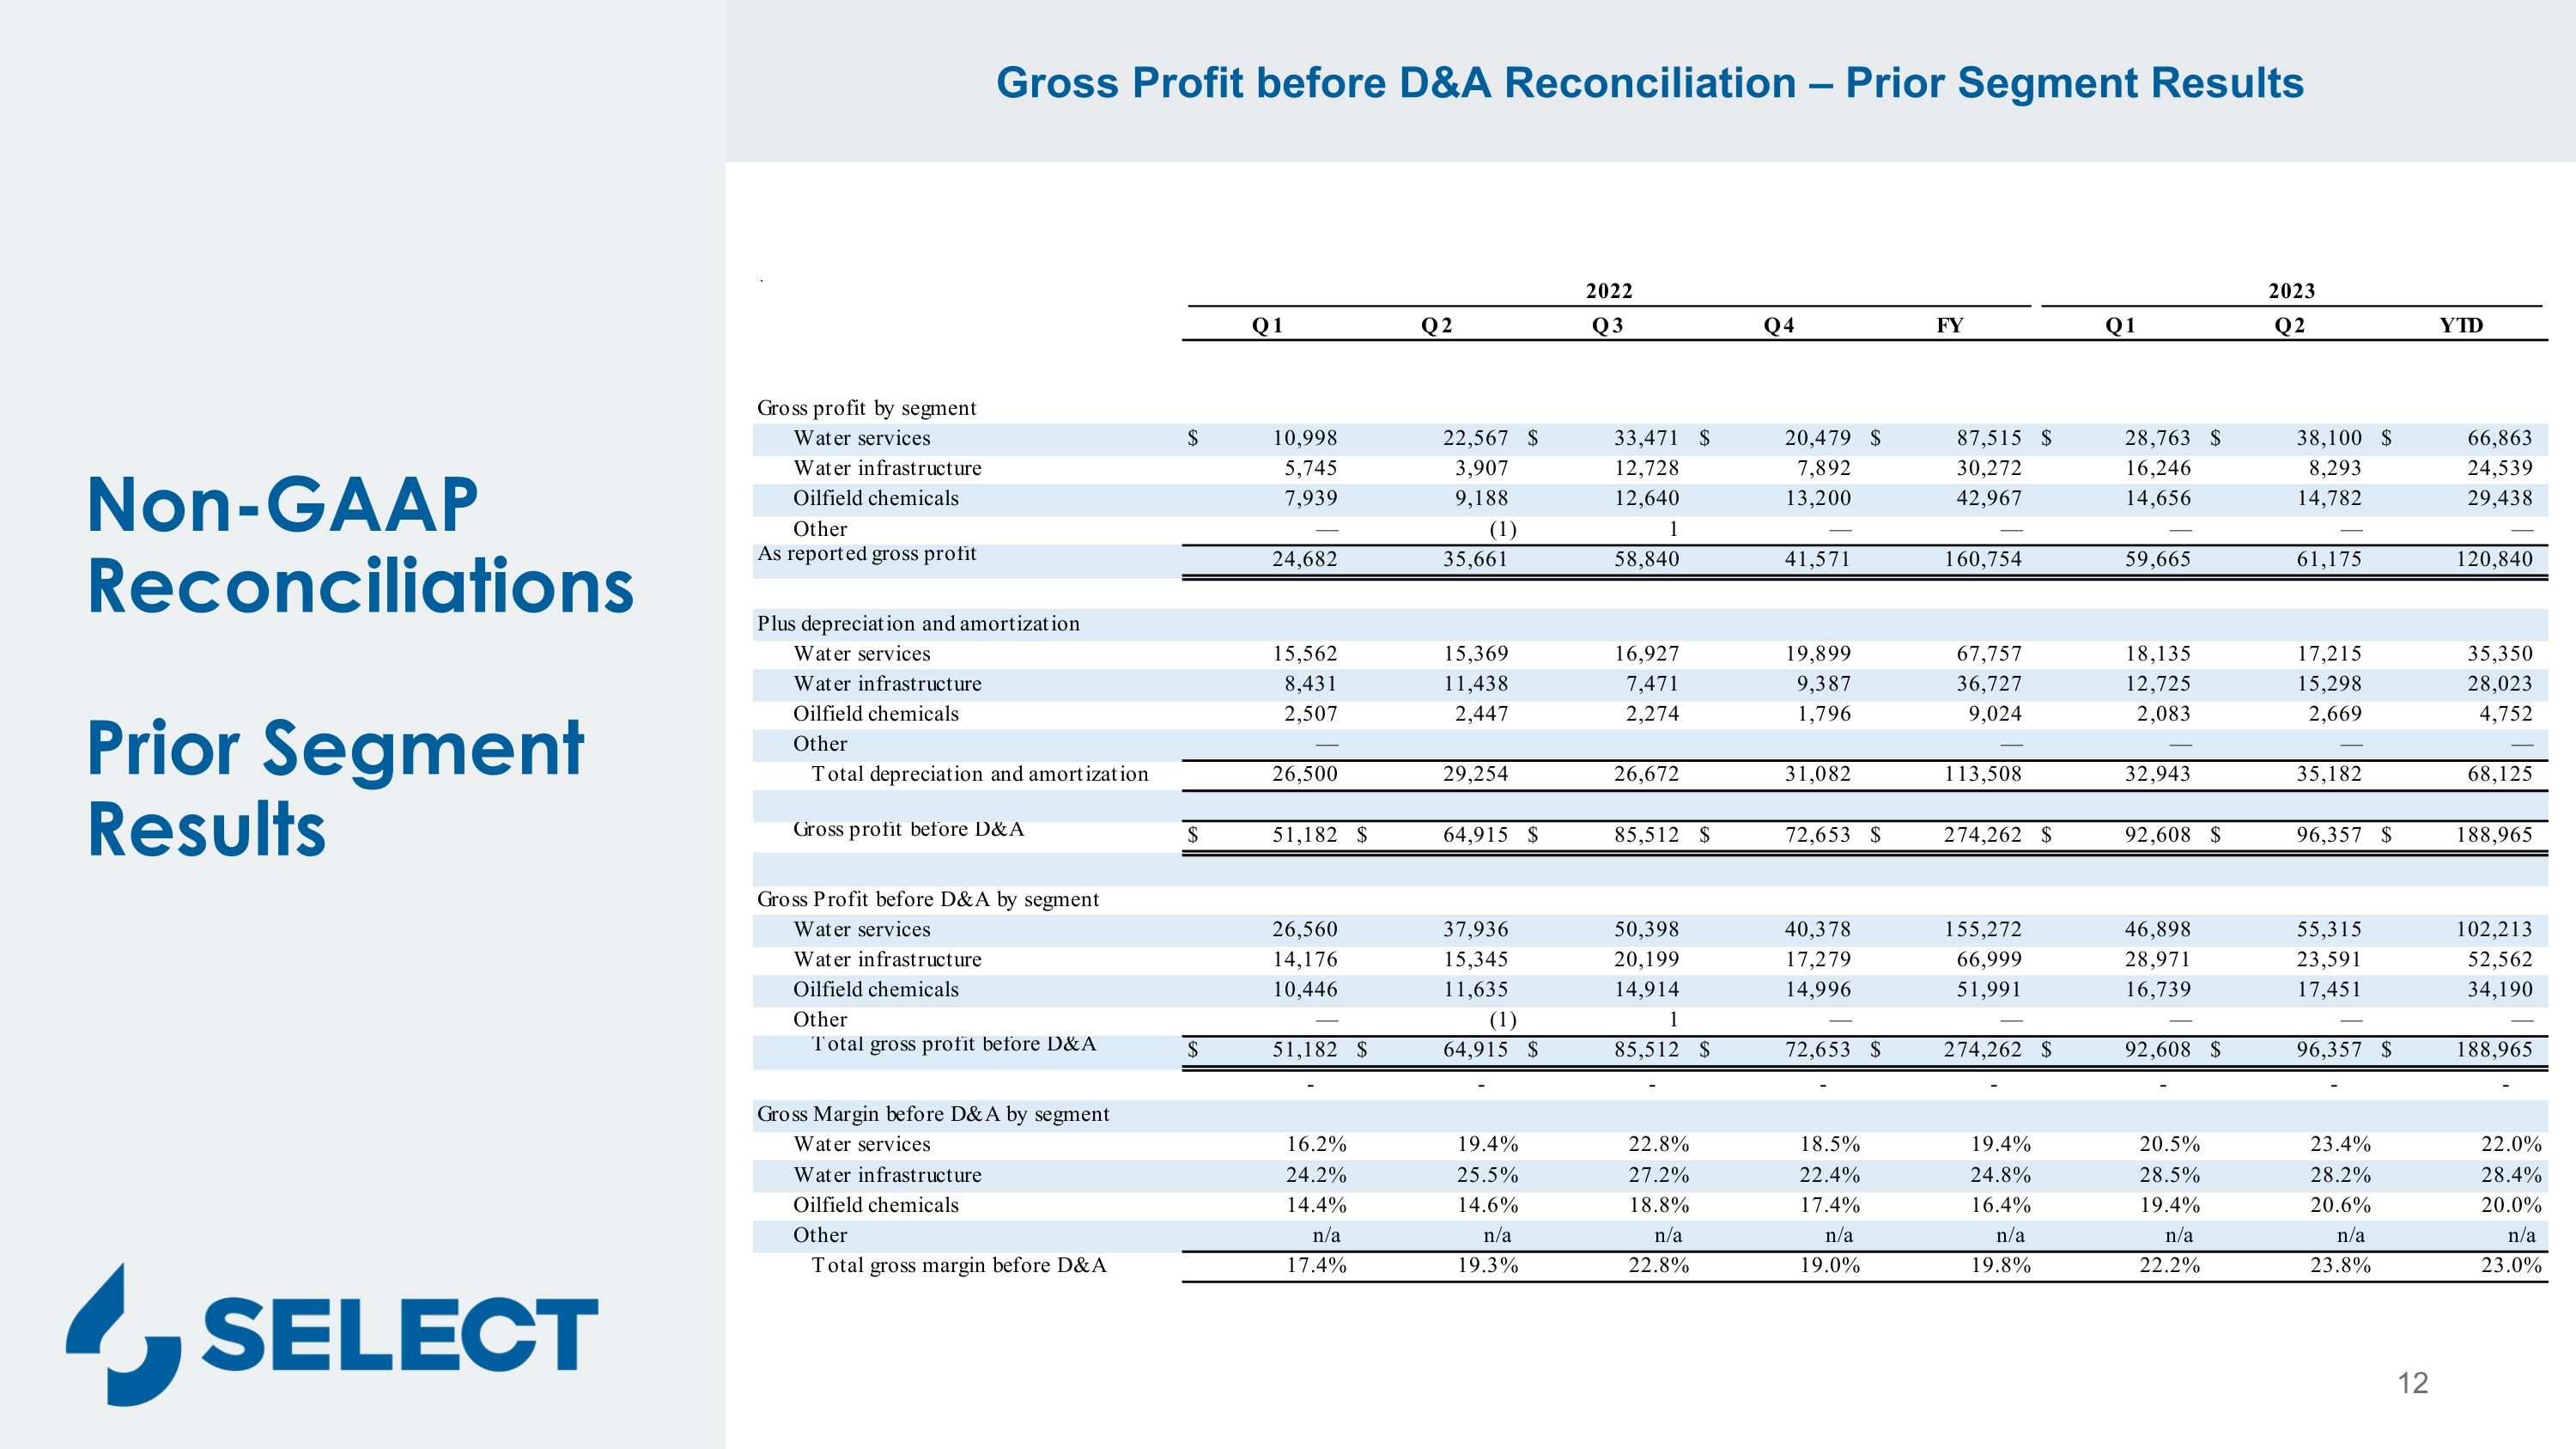
Non-GAAP ReconciliationsPrior Segment Results Gross Profit before D&A Reconciliation – Prior Segment Results 12