10-K: Annual report [Section 13 and 15(d), not S-K Item 405]
Published on February 18, 2026
UNITED STATES
SECURITIES AND EXCHANGE COMMISSION
Washington, D.C. 20549
FORM
(Mark One)
ANNUAL REPORT PURSUANT TO SECTION 13 OR 15(d) OF THE SECURITIES EXCHANGE ACT OF 1934 |
For the fiscal year ended
OR
TRANSITION REPORT PURSUANT TO SECTION 13 OR 15(d) OF THE SECURITIES EXCHANGE ACT OF 1934 |
For the transition period from to
Commission file number
(Exact name of registrant as specified in its charter)
| ||
(State or Other Jurisdiction of Incorporation or Organization) | (I.R.S. Employer Identification No.) | |
(Address of Principal Executive Offices) | (Zip Code) |
Registrant’s telephone number, including area code (
Securities registered pursuant to Section 12(b) of the Act:
Title of each class | Trading Symbol(s) | | Name of each exchange on which registered | |
Securities registered pursuant to Section 12(g) of the Act:
NONE
Indicate by check mark if the registrant is a well-known seasoned issuer, as defined in Rule 405 of the Securities Act.
No ☐ |
Indicate by check mark if the registrant is not required to file reports pursuant to Section 13 or Section 15(d) of the Act.
Yes ☐ |
Indicate by check mark whether the registrant (1) has filed all reports required to be filed by Section 13 or 15(d) of the Securities Exchange Act of 1934 during the preceding 12 months (or for such shorter period that the registrant was required to file such reports) and (2) has been subject to such filing requirements for the past 90 days.
No ☐ |
Indicate by check mark whether the registrant has submitted electronically every Interactive Data File required to be submitted pursuant to Rule 405 of Regulation S-T (§232.405 of this chapter) during the preceding 12 months (or for such shorter period that the registrant was required to submit such files).
No ☐ |
Indicate by check mark whether the registrant is a large accelerated filer, an accelerated filer, a non-accelerated filer, a smaller reporting company or an emerging growth company. See the definitions of “large accelerated filer,” “accelerated filer,” “smaller reporting company” and “emerging growth company” in Rule 12b-2 of the Exchange Act.
☑ | Accelerated Filer | ☐ | |
Non-accelerated Filer | ☐ | Smaller reporting company | |
Emerging growth company |
If an emerging growth company, indicate by check mark if the registrant has elected not to use the extended transition period for complying with any new or revised financial accounting standards provided pursuant to Section 13(a) of the Exchange Act. ☐
Indicate by check mark whether the registrant has filed a report on and attestation to its management’s assessment of the effectiveness of its internal control over financial
reporting under Section 404(b) of the Sarbanes-Oxley Act (15 U.S.C. 7262(b)) by the registered public accounting firm that prepared or issued its audit report.
If securities are registered pursuant to Section 12(b) of the Act, indicate by check mark whether the financial statements of the registrant included in the filing reflect the correction of an error to previously issued financial statements.
Indicate by check mark whether any of those error corrections are restatements that required a recovery analysis of incentive-based compensation received by any of the registrant’s executive officers during the relevant recovery period pursuant to §240.10D-1(b). ☐
Indicate by check mark whether the registrant is a shell company (as defined by Rule 12b-2 of the Act).
Yes | No ☑ |
The aggregate market value of the voting and non-voting common stock held by non-affiliates of the registrant computed as of June 30, 2025 (the last business day of the registrant’s most recent completed second fiscal quarter) based on the closing price of the Class A common stock on the New York Stock Exchange was $
Documents Incorporated by Reference:
Portions of the registrant’s definitive proxy statement for the 2026 annual meeting of stockholders, to be filed no later than 120 days after the end of the fiscal year, are incorporated by reference into Part III of this Annual Report on Form 10-K.
Table of Contents
2
GLOSSARY OF CERTAIN TERMS |
The terms and abbreviations defined in this section are used throughout this Annual Report. AMI. Areas of Mutual Interest ARO. Asset Retirement Obligation ASC. Accounting Standards Codification AST. Above-ground Storage Tank ASU. Accounting Standards Update AV Farms. AV Farms, LP BLM. Bureau of Land Management CAA. Clean Air Act C&A. C&A Rollover Company, LLC CEO. Chief Executive Officer CERCLA. Comprehensive Environmental Response, Compensation and Liability Act CFO. Chief Financial Officer CODM. Chief Operating Decision Maker COSO. Committee of Sponsoring Organizations of the Treadway Commission CTO. Chief Technology Officer CWA. Clean Water Act DJ Basin. Denver-Julesburg Basin E&P. Exploration and Production EBITDA. Earnings before Interest, Taxes, Depreciation and Amortization EPA. Environmental Protection Agency ERP. Enterprise Resource Planning system ESA. Endangered Species Act ESG. Environmental, Social and Governance ESPP. Employee Stock Purchase Plan FASB. Financial Accounting Standards Board FCF. Free Cash Flow FLWM. Full Lifecycle Water Management GAAP. Generally Accepted Accounting Principles Geneses. Geneses Water, L.P. GHG. Greenhouse Gas IRA 2022. Inflation Reduction Act of 2022 LNG. Liquified Natural Gas LOE. Lease Operating Expenses LPA. Limited Partnership Agreement LTD. Limited MBTA. Migratory Bird Treaty Act MidCon. Midcontinent |
3
MSA. Master Services Agreement MVC. Minimum Volume Commitment NAAQS. National Ambient Air Quality Standard NIST CSF. National Institute of Standards and Technology Cyber Security Framework NOL. Net Operating Loss NORM. Naturally occurring radioactive materials NYSE. New York Stock Exchange OBBBA. One Big Beautiful Bill Act of 2024 OPA. Oil Pollution Act of 1990 OPEC/OPEC+. Organization of the Petroleum Exporting Countries (+ allies) OSHA. Occupational Safety and Health Administration PCAOB. Public Company Accounting Oversight Board PSU. Performance Share Unit RCRA. Resource Conservation and Recovery Act ROA. Return on assets ROFR. Right of First Refusal Sarbanes-Oxley. Sarbanes-Oxley Act of 2002 SDWA. Safe Drinking Water Act SEC. Securities and Exchange Commission SES Holdings. Select Energy Services Holdings, LLC SES Holdings LLC Agreement. The Eighth Amended and Restated Liability Company Agreement of SES Holdings, LLC SES Holdings LLC Units. Common units in Select Energy Services Holdings, LLC SOFR. Secured Overnight Financing Rate SRP. Safety Recognition Program SWA. Stop-Work Authority SWD. Saltwater Disposal Well SWR. Select Water Reuse, LLC TENORM. Technologically enhanced naturally occurring radioactive materials The Code. Internal Revenue Code of 1986 The Exchange Act. Securities Exchange Act of 1934, as amended The Securities Act. Securities Act of 1933, as amended TRA. Tax Receivable Agreements TSCA. Toxic Substances Control Act TSR. Total Shareholder Return UIC. Underground Injection Control U.S. United States U.S. DOT. U.S. Department of Transportation VIE. Variable Interest Entity VOC. Volatile Organic Compound WOTUS. Waters of the United States WTI. West Texas Intermediate WTTR. Select Water Solutions, Inc. |
4
CAUTIONARY NOTE REGARDING FORWARD-LOOKING STATEMENTS
The information in this Annual Report on Form 10-K includes “forward-looking statements” within the meaning of Section 27A of the Securities Act of 1933, as amended (the “Securities Act”), and Section 21E of the Securities Exchange Act of 1934, as amended (the “Exchange Act”). All statements, other than statements of historical fact, included in this Annual Report regarding our strategy, future operations, financial position, estimated revenues and losses, projected costs, prospects, plans and objectives of management are forward-looking statements. When used in this Annual Report, the words “could,” “believe,” “anticipate,” “intend,” “estimate,” “expect,” “project,” “preliminary,” “forecast,” and similar expressions or variations are intended to identify forward-looking statements, although not all forward-looking statements contain such identifying words. These forward-looking statements are based on our current expectations and assumptions about future events and are based on currently available information as to the outcome and timing of future events. When considering forward-looking statements, you should keep in mind the risk factors and other cautionary statements described under the heading “Risk Factors” included elsewhere in this Annual Report on Form 10-K, as well as those set forth from time to time in our other filings with the Securities and Exchange Commission (the “SEC”). These forward-looking statements are based on management’s current belief, based on currently available information, as to the outcome and timing of future events.
Important factors that could cause actual results to differ materially from those in the forward-looking statements include, but are not limited to, those summarized below:
| ● | global economic distress, including that resulting from the sustained Russia-Ukraine war and related economic sanctions, instability and continued hostilities in the Middle East, including increased tensions with Iran, instability and potential conflict with Venezuela, economic uncertainty as a result of changing trade policies, inflation and high interest rates, each of which may decrease demand for oil and natural gas or contribute to volatility in the prices for oil and natural gas, which may decrease demand for our services; |
| ● | actions taken by the members of the Organization of the Petroleum Exporting Countries (“OPEC”) and Russia (together with OPEC and other allied producing countries, “OPEC+”) with respect to oil production levels and announcements of potential changes in such levels, including the ability of the OPEC+ countries to agree on and comply with announced supply limitations, which may be exacerbated by increased hostilities in the Middle East, heightened tensions with Iran and the resumption of previously sanctioned oil from Venezuela; |
| ● | impacts related to changing United States (“U.S.”) and foreign trade policies, including increased trade restrictions or tariffs, the impact of changes in diplomatic and trade relations, and the results of countermeasures and any tariff mitigation initiatives; |
| ● | changes in global political or economic conditions, generally, and in the markets we serve, including the rate of inflation and potential economic recession; |
| ● | changes in safety, health, environmental and other governmental policy and regulation; |
| ● | the enactment or promulgation of new laws or regulations or changes or modifications in existing laws, regulations, rules or governmental policies with respect to taxation; |
| ● | the level of capital spending and access to capital markets by oil and gas companies in response to changes in commodity prices or reduced demand; |
| ● | the impact of central bank policy actions and disruptions in the bank and capital markets; |
| ● | the potential deterioration of our customers’ financial condition, including defaults resulting from actual or potential insolvencies; |
5
| ● | the degree to which consolidation among our customers may affect spending on U.S. drilling and completions, including the recent consolidation in the Permian Basin; |
| ● | trends and volatility in oil and gas prices, and our ability to manage through such volatility; |
| ● | the impact of current and future laws, rulings, governmental regulations and policies, including those related to accessing water, disposing of wastewater, transferring produced water, interstate freshwater and produced water transfer, chemicals, carbon pricing, pipeline construction, emissions, hydraulic fracturing, leasing, permitting or drilling on federal lands and various other environmental matters; |
| ● | the ability to source certain raw materials and other critical components or manufactured products globally on a timely basis from economically advantaged sources, including any delays and/or supply chain disruptions; |
| ● | regional impacts to our business, including our key infrastructure assets within the Permian Basin, the Bakken, and the Haynesville regions; |
| ● | capacity constraints on regional oil, natural gas and water gathering, processing and pipeline systems that result in a slowdown or delay in drilling and completion activity, and thus a decrease in the demand for our services in our core markets; |
| ● | the impact of regulatory and related policy actions by federal, state and/or local governments, such as the Inflation Reduction Act of 2022 (“IRA 2022”), which may negatively impact the future production of oil and gas in the U.S., thereby reducing demand for our services; |
| ● | our ability to hire and retain key management and employees, including skilled labor; |
| ● | our access to capital to fund expansions, acquisitions and our working capital needs and our ability to obtain debt or equity financing on satisfactory terms, or at all; |
| ● | our health, safety and environmental performance; |
| ● | the impact of competition on our operations; |
| ● | the degree to which our Exploration and Production (“E&P”) customers may elect to operate their water-management services in-house rather than source these services from companies like us; |
| ● | our level of indebtedness and our ability to comply with covenants contained in our Sustainability-Linked Credit Facility (as defined herein) or future debt instruments; |
| ● | delays or restrictions in obtaining permits by us or our customers; |
| ● | constraints in supply or availability of equipment used in our business; |
| ● | the impact of advances or changes in well-completion technologies or practices that result in reduced demand for our services, either on a volumetric or time basis; |
| ● | acts of terrorism, war or political or civil unrest in the U.S. or elsewhere, such as the Russia-Ukraine war, the instability and hostilities in the Middle East, including heightened tensions with Iran and any potential conflict with Venezuela; |
| ● | information technology failures or cyberattacks; |
6
| ● | accidents, weather, natural disasters or other events affecting our business; and |
| ● | the other risks identified in this Annual Report on Form 10-K, including, without limitation, those under the headings “Item 1A. Risk Factors,” “Item 1. Business,” “Item 7. Management’s Discussion and Analysis of Financial Condition and Results of Operations” and “Item 13. Certain Relationships and Related Transactions, and Director Independence.” |
These factors are not necessarily all of the important factors that could cause actual results to differ materially from those expressed in any of our forward-looking statements. Other unknown or unpredictable factors also could have material adverse effects on our future results. Our future results will depend upon various other risks and uncertainties, including those described elsewhere in this Annual Report. Readers are cautioned not to place undue reliance on forward-looking statements, which speak only as of the date hereof. We undertake no obligation to update or revise any forward-looking statements after the date they are made, whether as a result of new information, future events or otherwise. All forward-looking statements attributable to us are qualified in their entirety by this cautionary note.
Risk Factor Summary
Risks Related to Our Business Operations
| ● | Our business depends on capital spending by the oil and gas industry in the U.S. and reductions in capital spending could have a material adverse effect on our liquidity, results of operations and financial condition. |
| ● | Political instability or armed conflict, including in crude oil or natural gas producing regions and OPEC+ policy decisions. |
| ● | The failure to successfully integrate acquired assets or operations on a timely basis. |
| ● | Changes in U.S. and international trade policies, such as the imposition of tariffs, particularly involving China, may adversely impact our business and operating results. |
| ● | The IRA 2022 could accelerate the transition to new energy sources and could impose new costs on our customers’ operations. |
| ● | Our key infrastructure assets in Louisiana, North Dakota, New Mexico and Texas are immobile and thus vulnerable to risks associated with conducting business in these regions. |
| ● | Restrictions on the ability to procure water or changes in sourcing or disposal requirements could add costs or decrease demand for some of our services. |
| ● | Regulatory and societal efforts to reduce fossil fuel use and associated carbon emissions could reduce demand for oil and natural gas, and thereby the demand for our services, including as a result of the IRA 2022 or otherwise. |
| ● | We may be subject to claims for personal injury and property damage. |
| ● | We may be subject to cybersecurity risks. |
| ● | We may be adversely affected by uncertainty in the global financial markets and a worldwide economic downturn. |
| ● | A significant increase in fuel prices may adversely affect our transportation costs. |
| ● | Our industry typically experiences a high rate of employee turnover. |
Risks Related to Customers and Suppliers
| ● | Significant price volatility or interruptions in supply of our raw materials for our chemicals business may result in increased costs and negatively impact our financial results. |
| ● | Consolidation of our customers and competitors may expose us to concentration risk and otherwise impact our results of operations. |
7
Risks Related to Compliance with Regulations
| ● | Legislative and regulatory initiatives in the U.S. relating to hydraulic fracturing or water management could result in operating restrictions, delays or cancellations in our customers’ operations, reducing demand for our services. |
| ● | Our and our customers' operations are subject to a number of regulatory risks as a result of climate change initiatives. |
| ● | Our chemical products are subject to regulations that tend to become more onerous over time, which could result in increased costs. |
| ● | State and federal legislation and regulatory initiatives relating to our disposal operations and seismicity could harm our business. |
Risks Related to Our Capital Structure
| ● | If we fail to maintain and enhance an effective system of internal controls, we may not be able to accurately report our financial results or prevent fraud. |
| ● | We may incur indebtedness or issue additional equity securities to execute our long-term growth strategy. |
| ● | Our Sustainability-Linked Credit Facility subjects us to various financial and other restrictive covenants. |
| ● | Future sales or issuances of our equity securities may depress our share price or dilute your ownership. |
| ● | Provisions in our governing documents and Delaware law may discourage takeover attempts. |
| ● | Our amended and restated certificate of incorporation may limit certain corporate opportunities. |
| ● | Our amended and restated certificate of incorporation designates the Court of Chancery of the State of Delaware as the sole and exclusive forum for certain types of actions and proceedings. |
Risks Related to Our Organizational Structure
| ● | We are a holding company and our sole material asset consists of common units (“SES Holdings LLC Units”) in Select Energy Services Holdings, LLC (“SES Holdings”), which we are dependent upon for distributions and payments. |
| ● | We are party to two tax receivable agreements (“TRAs”) that require payments for certain tax benefits, and such payment amounts could be significant. |
| ● | In certain cases, payments under the TRAs may be accelerated and/or significantly exceed the actual benefits. |
| ● | If SES Holdings were to become a publicly-traded partnership taxable as a corporation for U.S. federal income tax purposes, we could experience tax inefficiencies. |
| ● | Our ability to use certain of our current and future net operating losses (“NOLs”) may be limited and could adversely affect our operating results and cash flows. |
| ● | Our investment in AV Farms could be materially and adversely affected by our lack of sole decision-making authority, our reliance on our co-investors’ financial condition, and disputes between our co-investors and us. |
General Risks
| ● | We may not be able to finance future growth of our operations or future acquisitions. |
| ● | The growth of our business through acquisitions may expose us to various risks. |
| ● | We may be required to take write-downs of the carrying values of our long-lived assets and finite-lived intangible assets as well as the carrying value of goodwill. |
8
PART I
ITEM 1. BUSINESS
Select Water Solutions, Inc. and its consolidated subsidiaries (collectively referred to as “Select,” the “Company,” “we,” “us,” or “our”) is a leading provider of sustainable water-management solutions to the energy industry in the U.S. As a leader in the water management industry, we place the utmost importance on safe, environmentally responsible management of water throughout the lifecycle of a well. Additionally, we believe that responsibly managing water resources through our operations to help conserve and protect the environment in the communities in which we operate is paramount to our continued success.
With a diverse geographic footprint across the U.S., we operate through three primary segments: Water Infrastructure, Water Services and Chemical Technologies.
Our Water Infrastructure segment develops, builds, and operates permanent infrastructure solutions to support full life cycle water management and waste treatment solutions. These solutions support both new oil and gas well development and ongoing production activity throughout the life of existing wells. Select’s infrastructure assets include permanent pipeline infrastructure, fixed and mobile treatment and recycling facilities, water storage facilities, saltwater disposal wells (“SWDs”) and landfill facilities. Select’s water infrastructure networks, including largescale pipeline networks and recycling infrastructure, can provide both economic and environmental benefits by reducing demand for freshwater, water disposal and water hauling by truck, while at the same time enabling economies of scale that can help reduce customer capital expenditures and lease operating expenses (“LOE”) over the life of a field. These water infrastructure networks can also help balance water supply across broad geographic areas and between customers to promote greater water reuse. As of December 31, 2025, Select’s water infrastructure network consisted of 2.4 million barrels per day of fixed recycling capacity, 2.3 million barrels per day of permitted disposal capacity and 35 million barrels of produced water storage capacity.
We are actively scaling our recycling-first network centered in the Permian Basin, where we are adding capacity across a growing set of fixed recycling facilities and large-diameter pipelines, most notably in the Northern Delaware portion of the Permian Basin. Following the completion of our projects currently under construction or under contract, we expect our operations to include 1.7 million barrels per day of active produced water recycling capacity and 26 million barrels of produced water storage. Our networks use large diameter, dual-line bidirectional designs to move produced water to treatment or disposal facilities and return treated volumes to completions. By prioritizing recycling, we effectively create synthetic disposal capacity without needing new wells, helping customers manage seismicity concerns and pore space limitations. The integration of Select’s water infrastructure with its last mile water transfer and field automation technologies that aim to enhance safety, reduce environmental risk, reduce truck traffic and improve network reliability. In the Rockies, we have established an initial footprint with one permanent recycling facility and are building a commercial base to support further development. Elsewhere, Select has maintained and grown market leading infrastructure positions in other major U.S. basins including market leading disposal positions in the Haynesville and Northeast regions as well as a leading solids management position in the Bakken region. While our recent growth and largest ongoing capital investments are predominantly Permian Basin-driven, we will pursue disciplined, customer-backed expansion in other regions as compelling opportunities arise.
Our Water Infrastructure operations and ongoing capital investments are underpinned by a growing portfolio of long-term contractual agreements, and accompanying customer commitments, that encompass the management of produced water over the entire production life of a well. These agreements, often more than a decade in duration, encompass a number of different types of contract structures, including acreage dedications, wellbore dedications, minimum volume commitments (“MVCs”), areas of mutual interest (“AMIs”) and right of first refusals (“ROFRs”). Additionally, we also structure supplemental interruptible commercial agreements that monetize spare capacity from nearby operators across our infrastructure networks.
Furthermore, we are advancing optionality in freshwater resource development for municipal and industrial offtake, as well as direct extraction of critical minerals such as lithium and iodine that may support long term, royalty type income streams associated with the produced water resources within our infrastructure. We are also pursuing advanced recycling solutions beyond traditional reuse for oil and gas operations that could enable the beneficial reuse of
9
produced water for non-energy applications. This could enable substitution of treated produced water in general industry and agriculture, or other stewardship-oriented applications such as wildlife rehabilitation, carbon capture and sequestration, or drought mitigation, among other opportunities. Further advancements could preserve substantial fresh water sources and enable the industry to become a contributor to the water lifecycle.
Our Water Services segment provides the complex services needed to support new well completions as well as ongoing production over the life of the well, including water transfer, water sourcing, water containment, fluids hauling, water monitoring and water network automation. Separately, through our Peak Rentals subsidiary, we offer mobile power solutions, including generator and battery storage solutions, other various on-site rental equipment and accommodation offerings, as well as flowback and well testing solutions. Through our patented AquaView® automation services and our proprietary software platform, our Water Services segment provides extensive technology solutions that enable 24/7 monitoring and visibility for our customers into all of their water-related operations, including hydrographic mapping, water volume and quality monitoring, remote pit and tank monitoring, leak detection, asset and fuel tracking and automated-equipment services. We believe these technologies help our customers lower their operating costs, improve well productivity, increase safety, reduce the risk of spills and reduce the environmental footprint of their operations.
Our Chemical Technologies segment develops, manufactures, manages logistics and provides a full suite of chemicals used in hydraulic fracturing, stimulation, cementing and well completions. Our completion chemicals are sold primarily to leading integrated and independent E&P companies and pressure-pumping service companies in the U.S. to support well stimulation and completion. We also provide customized water treatment and flow assurance solutions across the completion and production lifecycle. Additionally, through our FluidMatch™ solutions, we provide comprehensive testing and analysis of our customers’ application conditions, product chemistry and key performance requirements for oil and gas well completion fluid-system design. This process may include water profiling, application and fluid assessment, treatment assessment, product selection, optimization and customization.
Industry and Company Overview
Over the past two decades, advancements in horizontal drilling and completions technologies have led to significant and sustained growth in oil and natural gas production in the United States. Advances in drilling and completion technology have propelled shale oil production in the U.S. from about 500,000 barrels per day in 2010 to approximately 9 million barrels per day in 2025, which accounts for approximately 9% of the total global oil supply. Additionally, U.S. shale gas production has increased from about 15 billion cubic feet per day in 2010 to approximately 87 - 89 billion cubic feet per day as of December 2025, or nearly 80% of U.S. natural gas production and nearly 20% of global natural gas supply.
Water management is essential to the development, completion and production of unconventional oil and gas wells. Water naturally exists in subsurface geologic formations that contain oil and natural gas deposits and is produced alongside, and typically in higher volumes than, hydrocarbons throughout the full life cycle of oil and natural gas wells. Produced water must be reliably gathered, separated and treated for either reuse or disposal in order for these wells to be brought online and remain in production.
Additionally, the modern hydraulic fracturing process involves the high-pressure injection of large volumes of water and proppant, together with chemicals, through a cased and cemented wellbore into targeted subsurface formations thousands of feet below ground to fracture the surrounding rock. Water management is a critical daily operational requirement for maintaining oil and gas production, underscoring the importance of Select’s operations in supporting our customers’ evolving needs. Accordingly, water management costs represent a significant portion of our customers’ drilling and completion capital expenditures for the development of new wells as well as their LOE over the life of a well’s productivity.
The volume of water produced by the oil and gas industry as well as the volume of water required to economically produce tight oil and gas reserves in the U.S. has grown significantly in recent years, though the total volumes of flowback and produced water are significantly greater than the volumes used for new well completions. By
10
some estimates, the U.S. oil and gas industry today produces approximately 23.6 billion barrels of water per year, as compared to 23.2 billion barrels of water per year in 2024. This volume is estimated to grow modestly, even in a flat oil production environment in the U.S., as new oil production is heavily weighted towards U.S. basins with high water production ratios. Additionally, the water demand for new well completions has been approximately 5.4 billion barrels per year in recent years, but is projected to decline slightly to 5.1 billion barrels in 2026.
Up to fifty percent of the water pumped into the well during the hydraulic fracturing process returns as “flowback” water during the first several weeks following the well completion process, and a large percentage of the remainder, plus naturally occurring water in the producing formation, is recovered as produced water over the life of the well. This flowback and produced water must be captured, contained and then either treated and recycled for reuse in subsequent fracturing jobs or disposed of in an environmentally-responsible manner. Select owns and operates the largest network of centralized recycling facilities in the industry for the gathering, recycling and reuse of flowback and produced water. Furthermore, Select operates a diverse portfolio of more than one hundred water disposal facilities for the safe and environmentally-responsible disposal of excess flowback or produced water. Additionally, our customized chemical treatment programs help improve well productivity and reduce production costs, thereby extending the economic life of our customers’ oil and gas wells.
As produced water volumes have significantly grown in recent years, logistical advancements have been developed for managing these produced water volumes. Increasingly, the transportation of these produced water volumes has shifted away from traditional tank truck operations to gathering pipeline infrastructure for both disposal or recycling and reuse. Recycling produced water through dedicated infrastructure for reuse can significantly reduce the lease operating costs for our customers over the life of a well, and may also reduce the environmental impact and carbon footprint of our customers’ operations by limiting truck traffic and diesel exhaust emissions in our local communities.
Our customers’ current multi-well pad development plans can require in excess of five million barrels of water to complete all of the wells on the pad location. Furthermore, in recent years and in the pursuit of further operational and economic efficiencies, operators utilized advanced drilling and completions technologies, requiring 24/7 operations, and resulting in multi-well pad development, multi-fracturing completion operations, increased lateral wellbore lengths and the overall increased complexity and intensity of daily operations. This has resulted in a single pad location requiring upwards of five million barrels of water, as compared to what may have been an equivalent of 75,000 barrels of water at a single well location in 2010.
Significant mechanical, logistical, environmental and safety issues related to the sourcing, transfer, storage and treatment of such large volumes of water and the rate of delivery have increased both the total cost of water and related services and the complexity and importance of the services required. Additionally, this increased volumetric demand for new well completions has resulted in fresh water availability concerns in certain areas in which we operate, driving increased demand for recycling solutions. This trend has shifted many of our customers’ operational focus away from legacy small, local water service providers, to larger regional and national players like us, who have the expertise, technology and scale to provide high-quality, reliable, comprehensive and environmentally responsible water-management solutions for the full extent of the water lifecycle.
Delivering these comprehensive and environmentally responsible water management solutions requires significant logistical expertise to overcome the challenges of gathering, treating, blending, and delivering significant volumes of produced water or treated produced water. These logistical challenges are typically met through a combination of temporary and permanent solutions utilizing pipe and hose infrastructure to deliver water across the broad geographic areas in which we operate. These logistical solutions significantly reduce the cost and environmental footprint compared to legacy solutions such as tank truck and frac tank operations. For a single representative multi-well pad that requires five million barrels of water, we can utilize our pipe and hose infrastructure solutions and eliminate the approximate equivalent of 38,500 tank truck loads from the roads. This can significantly reduce the capital and operating expenses for our customers while dramatically improving the safety of our operations. Importantly, these solutions also aim to reduce the environmental impact and carbon footprint of our customers’ operations by limiting spills and diesel exhaust emissions, as well as reducing the social impact of heavy vehicle traffic in the communities in which we operate.
11
We also develop and source water treatment and completion chemicals that are a critical part of the U.S. energy industry. Water treatment chemicals enable a barrel of water to be used in ongoing operations while completion chemicals are blended with water to improve the transport and placement of proppant in targeted zones within the producing geological formations. The induced fractures near the wellbore allow hydrocarbons to flow into the wellbore for extraction. Our team of chemists and research and development personnel work directly with our customers to support the optimization of water quality and their fracturing fluid systems through our FluidMatch™ solutions. Through laboratory and application experience, we apply our expertise in chemistry to develop, manufacture and supply a wide range of specialized and customizable products to our customers for their well completion fluid systems.
Ultimately, our customers are required to manage more than 24 billion barrels of produced water annually, and we are focused on how we can create the most beneficial resource out of what has historically been viewed solely as a waste stream, while still managing the remaining waste stream in an economically and environmentally-conscious manner. We believe the industry will increasingly turn to specialized water solutions companies like us to help cost-effectively manage produced water in an environmentally responsible manner. Select intends to play an important role in the advancement of water and chemical solutions that are designed to meet the sustainability goals of all stakeholders.
Investments, Acquisitions and Announcements - 2025 Year-in-Review
During 2025, we executed a number of strategic acquisitions, investments and divestments, with a particular focus on advancing the current and future growth of our Water Infrastructure segment. We executed a series of strategic asset acquisitions to expand our water infrastructure footprint across both the Permian Basin and the Northeast Region. In the Permian Basin, we acquired surface acreage, multiple SWDs, water storage assets, and a pipeline system connecting a key customer’s operations to a Select recycling facility. These assets are located across Lea County and Eddy County in New Mexico, as well as Howard County, Upton County, and Winkler County in Texas, further strengthening our integrated network of treatment, disposal, gathering, and recycling infrastructure in core production areas of the Permian Basin. In addition, certain acquired SWD sites allow for the potential development of additional wells or recycling facilities in the future. In the Northeast Region, we acquired three SWDs in Ohio, expanding our market leading disposal presence in the region. Collectively, these transactions enhance Select’s ability to deliver full-cycle water management solutions across its footprint, supporting both near-term operations and long-term growth.
During February 2025, we formed AV Farms to build a scaled, high-margin, long-duration water platform targeting the under-supplied Colorado municipal and industrial market. AV Farms consolidated 16,300 acre-feet of senior annual water rights, reservoir storage, and pipeline connectivity, laying the foundation for a commercial water banking and lease-fallow program. The venture is structured to deliver multi-decade contracts with pricing escalators and volume commitments, supported by $146 million of phased investment by us. With full buildout, AV Farms could generate significant gross profit and long-term cash flows. This opportunity aligns with our broader transformation into a water infrastructure company with an expanded base of contracted, high-visibility cash flows. Over time, AV Farms has the potential to evolve into a durable, multi-use water platform serving municipal, agricultural, and industrial stakeholders across the region.
On July 1, 2025, we acquired a high-margin Bakken platform anchored by long-lived infrastructure from Omni Environmental Solutions (“Omni”): a special-waste landfill with approximately 3.2 million cubic yards of remaining capacity, a processing and recovery facility for reclaiming diesel and other hydrocarbons from oilfield waste, a permitted Class II SWD with capacity of approximately 12,000 barrels per day, and a commercial tank farm with approximately 24,000 barrels of oil storage. As part of the same transaction, we divested certain lower-margin operations including trucking operations in the Bakken, Northeast and MidContinent (“MidCon”) regions, rental operations in the Bakken and one MidCon SWD. Approximately 280 fluids-hauling employees moved with those businesses, which together represented approximately 8 percent of Water Services segment revenue in the first half of 2025. This transaction expanded our market leading solids management business in the Bakken, while reducing exposure to noncore trucking and hauling.
In August 2025, we announced that we had started an evaluation of strategic alternatives for our Peak Rentals business within the Water Services segment. Peak Rentals currently includes our accommodations and rentals platform along with our well testing and flowback operations. This evaluation includes a range of potential paths forward,
12
including capital structure initiatives and other portfolio optimization opportunities. As of December 31, 2025, no transaction is pending or imminent, and we continue to own 100% of the business. We are continuing to evaluate strategic alternatives for Peak Rentals in the ordinary course; however, there can be no assurance that any particular outcome will ultimately be pursued or completed.
Industry Observations & Looking Ahead
The energy industry in 2025 continued to navigate a complex landscape shaped by global economic factors, geopolitical tensions, and evolving energy policies. Natural gas prices have risen, averaging near $3.50 per MMBtu compared to the prior year average near $2.00 per MMBtu. Oil prices have declined, with WTI crude oil around $65 per barrel compared to the prior year average of around $77 per barrel; however, the current price environment has supported steady drilling and completion activities in most basins in which we have strategically positioned our operations.
The industry's focus on capital discipline and operational efficiency has intensified, driving demand for integrated water management solutions that optimize costs and enhance environmental performance. This trend aligns well with our strategy of providing comprehensive water infrastructure and chemical solutions. As operators prioritize free cash flow (“FCF”) generation and responsible development practices, our services become increasingly vital to their operations.
Looking ahead to 2026, we anticipate a continued emphasis from our customers on sustainable production, with operators balancing output increases against market demand, pricing and environmental considerations. While we expect the regulatory environment to remain supportive of steady or increased drilling and completion activities, the ongoing energy transition is likely to accelerate water management challenges, as growing industrial demand, including growing power demand, increases stress on overall water resources. This scenario presents significant opportunities for our water recycling and disposal capabilities, particularly in regions facing water scarcity or stringent regulatory environments.
Traditional energy demand projections remain resilient, supporting a cautiously optimistic outlook for oil and gas activity levels. Furthermore, demand for natural gas-powered electricity generation is expected to grow in the near-term as the growth in industrial electrification as well as the rapid buildout of data centers and other industrial capacity to support artificial intelligence drive rapidly growing power requirements and electric grid infrastructure expansion. However, potential headwinds include inflationary pressures, supply chain constraints and international economic and political concerns. We continue to monitor the evolving regulatory landscapes, especially concerning emissions and water management. Our diversified service offerings and strategic infrastructure investments, including recent acquisitions and new recycling and pipeline projects, position us well to adapt to these challenges and capitalize on emerging opportunities in this dynamic market environment.
Recent market conditions, including the war between Russia-Ukraine, hostilities in the Middle East, instability and potential conflict with Venezuela, and elevated interest rates and levels of inflation, have created volatility in the markets in which we and our customers operate. During 2025, the West Texas Intermediate spot price for oil ranged from a low of $55.44 per barrel in December to a high of $80.73 per barrel in January, and the Henry Hub spot price for natural gas ranged from a low of $2.65 per MMBtu in June and October to a high of $9.86 per MMBtu in January.
Further, beginning in late 2025, the U.S. seized several oil tankers suspected of transporting oil from Venezuela, and, in early 2026, the U.S. launched a limited military intervention in Venezuela which culminated in the capture of Venezuela’s incumbent president. As the situation stabilizes and U.S.-Venezuela relations improve, it is expected that approximately 50 million barrels of sanctioned oil may become available for export as U.S. sanctions are lifted. The resumption of such exports may cause a depression in global oil prices as the market adjusts to such an increase in supply.
Sustainability
We are committed to a corporate strategy that supports the long-term viability of our business model in a manner that focuses on all stakeholders, including our people, our customers, the environment, and the communities in
13
which we operate. We believe this focus will help us and our customers achieve their short-term and long-term strategic goals, help us attract and retain top talent, and further our efforts to generate superior investor returns. We believe our commitment to foster a culture of corporate responsibility is an important part of being a company with operations spanning the contiguous U.S. Further, we believe being a good corporate steward is strategic to our growth in the energy industry and will better allow us to develop solutions that both address the needs of our customers and contribute to sustainable business practices. Our commitment to these principles is exemplified through our sustainability-linked credit facility, which incorporates certain key performance indicator targets related to growing produced water recycling volumes and maintaining market-leading employee safety performance. Additionally, as a customer-oriented company, we compete with other providers based on various factors, including safety and operational performance, technological innovation, process efficiencies and reputational awareness. We have identified the following four priorities as part of our comprehensive corporate responsibility initiative: Environmental Stewardship, Safety & Well-being, Human Capital Management and Community Outreach. We believe there is a strong link between these corporate responsibility initiatives and our ability to provide value to our stakeholders.
Environmental Stewardship
We are one of the few public companies whose primary focus is on the management of water and water logistics in the energy industry with a focus on driving efficient, environmentally responsible, and economic solutions that lower costs throughout the lifecycle of the well. We believe water is a valuable resource and understand that the energy industry, other industries, and the general public are competing for this resource. We continue to provide access to water as demanded by our customers and have significantly increased our focus on the recycling and reuse of produced water, as well as assessing other industrial water sources, to meet the industry’s water demand and align our operations with the goals of our customers. We have invested significantly in the development and acquisition of fixed and mobile recycling facilities that support the advancement of commercialized produced water reuse solutions. By doing so, we strive to reduce the amount of produced water being reinjected into SWDs and to reduce our usage of fresh water as well as that of our customers. By implementing our innovative approach to end-to-end water solutions, we have become a leader in recycling produced water to be reused for energy production. See Part I, Item 1. “Business – Competitive Strengths” and “—Description of Business Segments” for more discussion on our operating capabilities and expertise around advancing sustainable water and chemical solutions.
Safety & Well-being
Safety Culture: We maintain a culture of safety, committed to the protection of the health and safety of our employees, as well as preserving the environment and our relationships with the communities in which we operate. We place a strong emphasis on the safe execution of our operations, including safety training for our employees and the development of a variety of safety programs designed to make us a market leader in safety standards and performance. We have a comprehensive approach to formulating and managing training requirements for all of our operational employees. This includes mandatory participation in monthly, quarterly, and annual environmental, health and safety meetings, a combination of in-person training and computer-based training tailored to specific job-duties and operational activities, and comprehensive safety reference material. We also empower operational personnel with stop-work authority (“SWA”) as a tool to advance our safety culture. Our SWA policy empowers our employees to stop work whenever they identify unsafe work conditions.
Safety Recognition Program (SRP): The investment and creation of our SRP in 2016 has had a profound impact on our organization. By acknowledging and rewarding employees for their commitment to safety, we have witnessed a significant improvement in overall workplace safety culture. Employees are more vigilant, proactive, and engaged in promoting a safe working environment. Incidents and accidents have seen a noticeable decline, reflecting the program's success in fostering a collective sense of responsibility for safety. Additionally, the positive reinforcement from the SRP has boosted employee morale and teamwork, creating a ripple effect that extends beyond safety practices, contributing to a healthier and more productive workplace overall.
To support the ongoing health and well-being of our employees, we offer a competitive benefits package for regular, full-time employees, such as medical, dental and vision, life and accident insurance, and an employee assistance program to support employees and their families’ mental well-being through life’s changing circumstances. We’re also
14
proud to offer the Select Family Fund as a resource to employees. Established in 2020, the Family Fund assists employees in crisis situations. The program is funded by employee donations via payroll deductions with an annual company match.
Human Capital Management
Attracting, retaining, and developing the talent needed to address current and future business needs is a key component of our human capital strategy. We invest in our workforce by offering competitive wages and benefits, continually working to create a strong company culture, and engaging our talent. We have an industry-leading safety program that makes our Company an attractive place to work. As of December 31, 2025, approximately 3,300 employees were part of the Select team.
Our human capital measures and objectives focus on several areas including, but not limited to, culture, safety and well-being, employee retention, human rights and social responsibility, and operational execution.
Culture: Culture is an integral part of our operations because of its profound impact on recruitment, job satisfaction, work performance and morale and begins with our mission and core values. We are all connected by WATER, including our values – Working Safe, Accountability, Teamwork, Excellence, Respect. These are the foundations for how we accomplish our mission to deliver operational excellence and develop sustainable water and chemistry solutions every day. Our employees put our core values into action daily to improve operational excellence, safety, and the customer experience.
To help build a strong company culture, our employee recognition program acknowledges and celebrates employees who live our values through their work and interactions. At Select, we know that many drops of excellence can create a wave of impact. Drop of Excellence is our highest recognition award for our employees, and the recipients of such recognition represent the best of the best across the Company. Drop of Excellence nominations are submitted by executive leadership, and the award recognizes individuals that have made significant contributions to our success and serving our customers.
Employee Retention: From organizational announcements to quarterly leadership updates and employee initiatives, a strong cadence of communication helps our employees be successful and informed in their roles and be equipped to lead their teams through change. Communications and change management will continue to play a key role for how employees and leaders navigate their role. Employee development is encouraged through regular, constructive dialogue, including semi-annual one-on-one conversations about well-being, performance, and growth, facilitated by a formal feedback program. This approach ensures our core values are integrated into daily operations, fostering a culture of continuous improvement and alignment with our strategic goals. Our approach to employee development encourages managers and supervisors to engage in constructive dialogue with their direct reports, focusing on performance, continuous improvement, and growth opportunities. Through these initiatives, Select aims to maintain a culture of development, operational excellence, and commitment to our employees’ well-being and professional growth.
We also recognize the importance of intentional development through succession planning, and the long-term benefit of improved engagement. Select has an online employee job portal that allows employees to apply for open positions quickly and easily within the Company, whether it be a change of location, a promotion, or a new position in a different service line. In some service lines where career progression can be easily mapped, job progression is outlined allowing an employee to visualize the path necessary to achieve job competency, mastery, and promotion.
Human Rights & Social Responsibility: Select recognizes the many benefits of having a diverse workforce and is committed to conducting business in a manner that respects all human rights. Select is committed to promoting and encouraging respect for people and fundamental freedoms for all without distinctions of any kind, such as race, color, sex, language, religion, or political or other opinions. We are committed to partnering with employees, customers, vendors and other stakeholders directly linked to our operations that share our commitment to these same principles. We demonstrate this commitment in our employment practices, through our Code of Conduct, our Equal Employment Opportunity Employer Policy, and our Anti-Harassment Policy, as well as through our policies
15
on safety and security for our employees. Select provides several ways for individuals to raise concerns anonymously via our Ethics Reporting System or Environmental Health & Safety Hotline.
Community Outreach
As a company operating in various communities throughout the United States, Select values the hospitality of the local communities we call home. We are dedicated to being an exemplary neighbor by adhering to strict environmental standards, promoting workplace safety, and contributing to the communities where we operate. Select collaborates with numerous non-profit organizations and industry groups centered on environmental and social causes. By dedicating our time and resources, we actively contribute to the development of strong communities and create an improved environment for our employees, customers, and communities at large. In today’s world, where the demands for high-performance solutions are more crucial than ever, we recognize the importance of meeting these demands while actively embracing environmentally responsible practices within the communities we serve. Select steadfastly maintains its commitment to delivering solutions that align with these principles.
We also believe in taking a proactive role to create dialogue with landowners, communities, operators, local agencies, and state agencies in areas where oil and gas activities occur. We view each of these constituents as a partner to our Company and have identified the following areas of focus as we foster these partnerships: minimize our footprint; drive top-level performance while holding our team to a higher standard; strengthen our partnerships with landowners and customers in the areas in which we operate; minimize downtime and disruption; and cultivate long-term relationships with landowners and our customers to expedite resolution of issues in an efficient manner.
Operational Execution: It is critical that all Select employees that serve our customers are qualified and trained for their roles, understand our policies and work procedures, and receive the work direction necessary to operate safely. Site managers create daily weekly and monthly plans to coordinate tasks and personnel. Our employees use standard operating procedures and best practices to standardize effective and consistent execution. Our experienced employees often operate in a mentor capacity to provide guidance and instruction to less experienced employees and use videos to train and develop our operational personnel.
Description of Business Segments
We offer our services through the following three reportable segments: (i) Water Infrastructure, (ii) Water Services and (iii) Chemical Technologies.
Water Infrastructure Segment
Our Water Infrastructure segment provides recycling, gathering, transferring and disposal of water. Water Infrastructure operations are provided through or enabled by a network of permanent pipeline infrastructure, water recycling and treatment facilities, water storage facilities, SWDs and landfills.
Water Infrastructure Service Lines
Our Water Infrastructure segment is divided into the following service lines:
| ● | Water Recycling & Reuse. We are the market leader in water treatment and recycling solutions for the energy industry, offering tailored infrastructure to meet specific customer water quality and delivery needs. Our Water Recycling & Reuse business utilizes both standard and proprietary processes and technology, including mechanical and chemical technologies, to provide high-quality, large volume throughput and cost-optimized recycling and reuse solutions for our E&P customers. These solutions are primarily designed for recycling and reusing flowback and produced water from existing operations to meet customer’s well completion water needs. Our recycling operations consist of mobile and fixed recycling infrastructure, including above-ground and in-ground containment, along with treatment and processing assets and facilities capable of recycling large volumes of produced water for reuse in new well development. |
16
We have invested significantly in developing produced water recycling infrastructure in recent years, commencing operations in both the Delaware and Midland Basin portions of the Permian Basin and Denver-Julesburg Basin (“DJ Basin”) portion of the Rockies Region. Our recycling process involves treating water by removing contaminants, sediments, and chemicals from water used during drilling and completions, enabling its reuse in further completion operations. This approach can significantly reduce freshwater consumption and minimize wastewater disposal, supporting a more sustainable approach to oil and gas operations.
We have experienced rapid organic growth in our recycling operations due to several factors, including the improved economic value proposition of our solutions for our customers, the commercial success of our business development team in securing long-term projects and increased utilization levels from existing asset bases. With a number of active construction projects ongoing, supported by new long-term contracts, we anticipate further growth ahead with planned expansions coming online during 2026. As of December 31, 2025, our combined mobile and fixed recycling operations now include a consolidated daily throughput capacity of approximately 2.9 million barrels per day of active produced water recycling capacity and 35 million barrels of produced water storage. Following the completion of our projects currently under construction or under contract, we expect our operations to include 3.3 million barrels per day of active produced water recycling capacity and 41 million barrels of produced water storage.
| ● | Pipelines & Logistics. We own and operate extensive pipeline networks designed to gather and distribute produced water and treated produced water volumes to our centralized recycling, disposal and storage facilities. We also have developed some of our larger, strategic water sources into comprehensive, permanent pipeline systems designed to provide water used for drilling, completion and production activity across a wide geography or to collect and redistribute produced water into our recycling and disposal facilities. In many instances, we also provide the associated storage and logistics needed to deliver the water directly to our customers’ wellsites. We have developed or acquired pipeline systems in the Permian Basin, including the Northern Delaware Basin of New Mexico and the Midland Basin in Texas, the Bakken Shale in North Dakota, the Haynesville Shale in Texas and Louisiana and the DJ Basin in Colorado within the Rockies region. These pipeline networks encompass more than 1,000 miles of temporary and permanent pipeline infrastructure and related storage facilities and pumps throughout the Permian Basin, more than 90 miles of gathering and distribution pipelines in the Bakken Shale, more than 85 miles of gathering and distribution pipelines in the Haynesville Shale and other long-term contracted gathering pipeline and distribution systems in the MidCon and Rockies regions. These pipelines transport a combination of fresh, brackish and produced water sources and include a number of long-term contracts, including take-or-pay agreements, minimum volume commitments and acreage dedications supporting the operations. |
| ● | Fluid Disposal. Select owns and operates a significant number of active SWDs spanning across the Permian, MidCon, Bakken, South Texas, Rockies, Marcellus/Utica, and Haynesville regions, establishing a leading presence in key unconventional basins. We also have substantial additional permitted, undeveloped disposal capacity and permits currently in process that provide growth opportunities in strategic areas. In aggregate, we command a daily permitted disposal capacity of more than 2.3 million barrels per day across our operational footprint. Our disposal services cater to both flowback water generated during and shortly following well completion operations and naturally-occurring produced water extracted during the oil and natural gas production process over the life of a well. |
| ● | Solids Management. Select operates six landfill and solids treatment facilities strategically positioned to support our customers' waste management needs in the Bakken, Northeast and Haynesville regions. In the Bakken region, this includes 2.9 million cubic yards of permitted disposal capacity on open cells across four landfills in North Dakota and Montana, with an additional 7.5 million cubic yards of permitted disposal capacity that would require additional cell buildouts at those landfills, which are permitted for specialized oilfield and industrial waste, including technologically enhanced naturally occurring radioactive materials (“TENORM“) and other non-hazardous industrial byproducts. Select also operates a solids treatment facility in Ohio within the Marcellus/Utica basin. This facility treats up to 3,000 barrels per day of liquids-equivalent contaminated and residual solids, offers tank cleanout and lab services, and connects |
17
| via pipeline to a Select wastewater disposal facility. In the Haynesville region, Select operates one slurry injection facility permitted for 15 thousand barrels per day of liquids-equivalent contaminated and residual solids. |
Water Infrastructure Geographic Areas of Operation
We provide our Water Infrastructure offerings in most of the major unconventional shale plays in the continental U.S., as illustrated by a “✓” in the chart below.
Geographic Region | |||||||
Marcellus / | |||||||
Services Provided | Permian | MidCon | Bakken | Eagle Ford | Utica | Haynesville | Rockies |
Water Recycling & Reuse | ✓ | — | — | — | — | — | ✓ |
Pipelines & Logistics | ✓ | ✓ | ✓ | — | — | ✓ | ✓ |
Fluid Disposal | ✓ | ✓ | ✓ | — | ✓ | ✓ | ✓ |
Solids Management | — | — | ✓ | — | ✓ | ✓ | — |
Water Infrastructure Customers
Our Water Infrastructure customers primarily include major integrated and independent U.S. and international oil and gas producers.
Water Infrastructure Competition
While our customers often award contracts after a competitive bidding process, the presence of existing infrastructure in an existing acreage position can be critical in realizing economic value. In addition to the reach and capacity of existing area networks, track record, the skill and competency of our people, pricing, safety, the ability to move sufficient volumes at scale and environmental performance are key factors in the bid evaluation. Equipment availability, location, construction timing and technical specifications can also be significant considerations. We have a successful track record of constructing organic infrastructure projects, utilizing our infrastructure to obtain various long-term contracts such as acreage dedications, well bore dedications, AMIs, MVCs, ROFRs and take-or-pay agreements, while maintaining operational capacity for short-term work that may emerge.
Certain large midstream companies offer some water-oriented and infrastructure services, though these are generally ancillary to their core businesses of gathering and transporting oil and gas volumes. There are also a limited number of public water-midstream-focused competitors. Additionally, certain of our E&P customers have invested in water infrastructure for their own operations. As a result, the water infrastructure competitive landscape is highly fragmented and our main competitors, aside from E&P companies, can often be private water midstream companies that focus on a more limited geographic area or service offering. We seek to differentiate ourselves from our competitors through our expansive scale and by delivering high-quality solutions throughout the sourcing, recycling and disposal elements of the water lifecycle, coupled with extensive regulatory expertise, well-trained people and a commitment to superior execution and a safe working environment. Additionally, we believe our ability to couple our Water Infrastructure with our Water Services and Chemical Technologies expertise provides an advantage relative to our competition.
18
Water Services Segment
Our Water Services segment consists of our water-related services businesses, including water sourcing, water transfer, fluids hauling, water monitoring, water containment and water network automation, primarily serving E&P companies. Additionally, this segment includes the operations of our accommodations and rentals and flowback and well testing businesses.
Water Services Service Lines
Our Water Services segment is divided into the following service lines:
| ● | Water Transfer. We believe we are the largest provider of water transfer services to the industry. Our Water Transfer service line installs temporary above-ground pipeline and pump systems that can be equipped with full automation to deliver water autonomously at high volumes and rates from a water source to water containment facilities (tanks and pits), or directly to the wellsite. |
We install layflat hose as part of a flexible water transfer solution that can be customized to fit a specific project. Our layflat hose allows for quick, cost-effective deployment and removal of transfer assets with limited environmental disturbance and can be quickly redeployed for new projects, including projects in different geographic regions. Layflat hose has a significantly lower risk of spills than most other types of temporary jointed pipe as a result of the strength and durability of the hose as well as the secure nature of any coupling joints used to connect multiple sections of hose. Our layflat hose consists primarily of 12-inch diameter segments, powered by mobile pumps. Historically, this equipment has been powered by diesel; however, we are actively developing and deploying electric pumping units, which should decrease emissions and further reduce the environmental impact of our operations. Depending on the requirements of a project, layflat hose may run from a water source directly to a containment area, such as an above-ground pit or storage tank, or to a wellsite. Water can also be transferred from one containment area to another as part of managing a larger supply network. Our customers generally prefer layflat hose to alternative temporary piping options due to the cost-effectiveness, limited environmental impact, customizability and reduced risk of spills.
TideLine™ is Select’s proprietary lay-flat transfer hose engineered specifically for produced water operations, with enhanced durability against chemical, thermal, and mechanical stress. It features a high-tensile reinforced core, abrasion-resistant outer layer, and serialized QR tracking for asset monitoring. TideLine underwent rigorous lab and field testing to validate performance under high total dissolved solids, oxidants, acids, and temperature fluctuations. Already deployed in the Permian basin and other regions, it sets a new standard in hose technology by improving reliability, traceability, and efficiency in Water Transfer operations.
| o | Water Network Automation. Our proprietary and industry-leading automation technologies provide integrated water transfer solutions with automated pump operation, automated valve control, automated blending and proportioning capabilities, automated manifolds, level monitoring and data collection with analytics. We are able to provide our customers with increased visibility into their water inventories and usage, improving their efficiency and decreasing their costs. Our technology also provides us with the unique ability to detect potential issues and prevent them from occurring, as well as to reduce manpower and equipment on certain jobs, in turn mitigating safety and environmental risks while reducing overall fuel emissions. |
| ● | Water Sourcing. Our Water Sourcing activities include providing water, permitting and, in some instances, necessary logistics required by our E&P customers to support their drilling and completion operations. Our sourcing efforts include identifying, developing and obtaining the right to use water from a variety of sources, including surface, subsurface, industrial, municipal and produced water. Through a portfolio of contracts with and permits from regulatory bodies, corporations and individual landowners, we have |
19
| secured rights of approximately one billion barrels of water annually from hundreds of strategically located sources across the U.S. |
| ● | Water Containment. We provide a diverse set of primary and secondary containment solutions for the temporary storage and containment of water and fluids. We believe we are the largest provider of high-capacity above-ground storage tanks (“ASTs”) in the U.S. We offer ASTs ranging in size from 4,500 to 82,000 barrels (or 189,000 to 3.4 million gallons) per tank, with remote monitoring capability in every major U.S. basin. Our ASTs provide a high-volume, low-cost containment alternative to traditional mobile storage tanks, which typically hold 500 barrels (or 21,000 gallons). ASTs can also be set up as part of our Water Treatment & Recycling service offerings, which can be bundled with our Water Sourcing and Water Transfer services. A 40,000 barrel AST can be delivered by three trucks and installed in a single day, replacing the equivalent of 80 trucks delivering individual 500-barrel mobile storage tanks. A reduction in truck traffic can provide a significant reduction in traffic congestion in local communities as well as the associated emissions from the transportation of mobile storage tanks. Our modular tank design allows for twenty different tank configurations to meet each customer’s individual needs. We also offer assorted secondary containment solutions, from drive-over to raised barriers and multi-ringed nested AST solutions, that are designed to reduce the risk and environmental impact of potential spills. |
| ● | Fluids Hauling. Our Fluids Hauling group provides transportation for water and various drilling, completion, and production fluids, utilizing our fleet of vacuum, winch and kill trucks, hot oilers, and hydrovacs, along with other related assets, such as mobile storage tanks. Our operations span the Permian, Eagle Ford, and Rockies regions. During 2025, we divested operations in the Bakken, Northeast and MidCon regions to Omni and closed down our Haynesville operations. |
| ● | Peak Rentals |
| o | Accommodations and Rentals. Our accommodations and rentals service line provides workforce accommodations and surface rental equipment supporting drilling, completion and production operations in the U.S. onshore energy industry. The services provided include fully furnished office and living quarters, freshwater supply and wastewater treatment and removal, portable power generation and light plants, internet, phone, intercom, surveillance and monitoring services and other long-term rentals supporting field personnel. |
| o | Well Testing and Flowback. Our well testing and flowback services, covering a dynamic range of temperature, pressure, volume and H2S concentrations, aims to add value for our customers by providing well productivity data associated with our services, including fracturing support, fracturing plug drill out, flaring operations, ventless flowback operations, sand management and production testing. Our specialized well testing equipment is outfitted with advanced metering and telemetry, bringing remote visibility to our customers. Services are provided by highly-trained personnel that specialize in delivering performance optimization, or our high demand equipment is available for rental without personnel. We believe we are one of the largest flowback and well testing providers both in service and rental equipment inventory to the U.S. land industry. Additionally, certain of our services utilize specialized, closed-loop vapor tanks that prevent the release of methane and vapors to the atmosphere during drill out and flowback operations. |
Some of our operations are governed by the Environmental Protection Agency’s (“EPA”) emissions regulations. For example, we offer green completions through our mobile production facilities, which is a collaborative process that attempts to safely contain and combust flare gas, reducing emissions at the wellsite. This can provide our customers with enhanced emissions reduction solutions to help meet their sustainability targets and initiatives without the need for an external power supply, further reducing the environmental impact.
| o | Power Generation Units. We offer a scalable Power Generation solution designed to support off-grid and remote-site energy needs across our areas of operation. The fleet comprises |
20
| approximately 350 diesel generators, 35 natural gas generators, and over 65 battery packs, which can be deployed in various combinations to meet site-specific requirements. Our operations personnel have the technical capabilities to rapidly mobilize and manage these assets in the field. The platform emphasizes cleaner-burning fuel sources and reduced noise relative to conventional alternatives. While currently used primarily to support workforce lodging, the offering is designed to scale into higher-load use cases, including oil & gas completion activity. |
Water Services Geographic Areas of Operation
We provide our Water Services offerings in most of the major unconventional shale plays in the continental U.S., as illustrated by a “✓” in the chart below.
Geographic Region | |||||||
Marcellus / | |||||||
Services Provided | Permian | MidCon | Bakken | Eagle Ford | Utica | Haynesville | Rockies |
Water Transfer | ✓ | ✓ | ✓ | ✓ | ✓ | ✓ | ✓ |
Water Sourcing | ✓ | ✓ | ✓ | ✓ | — | ✓ | ✓ |
Water Containment | ✓ | ✓ | ✓ | ✓ | ✓ | ✓ | ✓ |
Fluids Hauling | ✓ | — | — | ✓ | — | — | ✓ |
Peak Rentals | ✓ | ✓ | ✓ | ✓ | ✓ | — | ✓ |
Water Services Customers
Our Water Services customers primarily include major integrated and independent U.S. and international oil and gas producers.
Water Services Competition
Our industry is highly competitive. Our customers typically award contracts after a competitive bidding process. Operational track record, the skill and competency of our people, pricing, safety, technology and environmental performance are key factors in the bid evaluation. Equipment availability, location, service breadth and technical specifications can also be significant considerations.
Certain large domestic and international oilfield services companies offer some water-oriented and environmental services, though these are generally ancillary to their core businesses. As a result, the water solutions industry is highly fragmented and our main competitors are typically smaller and often private service providers that focus on water solutions and logistical services across a narrow geographic area or service offering. We seek to differentiate ourselves from our competitors by delivering comprehensive, high-quality services and equipment supported in many regions by fixed infrastructure networks, coupled with well-trained people and a commitment to sustainability, superior execution and a safe working environment.
Chemical Technologies Segment
Within our Chemical Technologies segment, we develop, manufacture, manage logistics and provide a full suite of chemicals used in hydraulic fracturing, stimulation, cementing and well completions. We sell chemicals and provide services primarily to leading E&P operators and pressure-pumping service companies in the U.S. We also provide customized water treatment and flow assurance solutions to our customers throughout the lifecycle of a well.
21
Chemical Technologies Service Lines
Our Chemical Technologies segment is made up of the following service lines:
| ● | Chemical Manufacturing. We are a specialty manufacturer of polyacrylamides, surfactants, crosslinkers and other custom chemistries. Polyacrylamides, or friction reducers, are water-soluble polymers that reduce friction and boost viscosity of the hydraulic fluid during application in energy production. We manufacture this reactive chemistry in Midland, Texas and Tyler, Texas with regional distribution facilities across the United States. Our in-basin manufacturing provides reduced lead times to decrease non-productive time on location for our customers with fully automated processes from raw materials to finished goods. We are among the largest manufacturers of friction reducers to the energy industry, producing anionic, cationic and viscosifying friction reducers. Our manufacturing is supported by in-house logistics and comprehensive lab services. |
| ● | Completion Chemicals. Our Completion Chemicals service line provides technical solutions, products and expertise related to chemical applications in the energy industry. We develop solutions, manage logistics and provide a full suite of chemicals used in hydraulic fracturing, stimulation, cementing, pipelines and well completions for customers ranging from major integrated and independent oil and gas producers to pressure pumpers. This service line also utilizes its chemical experience and lab testing capabilities to customize tailored water treatment solutions designed to optimize the fracturing fluid system in conjunction with the quality of water used in well completions. Through our Completion Chemicals service line, we develop and provide a full suite of chemicals utilized in hydraulic fracturing, stimulation and cementing, including polymers that create viscosity, crosslinkers, friction reducers, surfactants, buffers, breakers and other chemical technologies. We source our products through our own manufacturing operations as well as through third-party producers and distributors. We provide 24/7/365 time-critical logistical support to our customers and our warehousing and service includes inventory management with computerized tracking and monthly reporting. We use automated communications systems combined with direct-to-wellsite delivery to ensure seamless product availability for our customers. With our expertise in fracturing chemistry, we can develop customized products to meet customers’ frac-fluid system requirements. |
| ● | Water Treatment. Through our Water Treatment service line, we provide advanced water treatment solutions throughout the well lifecycle, as well as specialized stimulation flow assurance and integrity management, and post-treatment monitoring services in the U.S. land market. Our specialty chemicals are used in applications such as water conditioning, water recycling, on-the-fly treatment and water reuse and mining. Our chemical experts provide pre-treatment water sampling, analysis and testing to determine a water’s chemistry, then design the most effective fracturing fluid system. The team delivers customized programs using proven chemical technologies and mobile equipment to treat almost any oilfield water for reuse. Following our treatment applications, fluid samples are analyzed again to ensure the treatment is optimized to reduce overall chemical investment. Water Treatment provides disinfection solutions to neutralize microorganisms, hydrogen sulfide (H2S), iron sulfide, phenols, mercaptans, and polymers in the surface water. Our Water Treatment team works closely with our Completion Chemicals service line as well as our water monitoring, reuse and recycling teams within our Water Services and Water Infrastructure segments to advise our customers on the best economic and operational solutions to manage their water quality and chemical solutions needs. |
22
Chemical Technologies Geographic Areas of Operation
We provide Chemical Technologies services in most of the major unconventional shale plays in the continental U.S. In the chart below, a “✓” indicates that we offer the service line in the indicated geographic region.
Geographic Region | ||||||||
Marcellus / | ||||||||
Services Provided | Permian | MidCon | Bakken | Eagle Ford | Utica | Haynesville | Rockies | |
Chemical Manufacturing | ✓ | — | — | — | — | ✓ | — | |
Completion Chemicals | ✓ | ✓ | ✓ | ✓ | ✓ | ✓ | ✓ | |
Water Treatment | ✓ | ✓ | ✓ | ✓ | — | ✓ | ✓ | |
Chemical Technologies Customers
Our Chemical Technologies customers primarily include pressure pumpers, and major integrated and independent U.S. and international oil and gas producers.
Chemical Technologies Competition
The Chemical Technologies business is highly competitive. Our competitors include both large manufacturers and companies that are pure distributors of commodities and specialty chemicals. We believe that the principal competitive factors in the markets we serve are technical expertise, manufacturing capacity, workforce competency, efficiency, safety record, reputation, experience and price. Additionally, projects are often awarded on a bid basis, which tends to create a highly competitive environment. We seek to differentiate ourselves from our competitors by delivering high-quality services and solutions paired with water treatment expertise through our FluidMatch™ design solutions, coupled with superior execution and operating efficiency in a safe working environment. Additionally, many of our competitors focus on serving multiple industries outside of oil and gas, and therefore we believe our dedicated focus on the oil and gas industry and in-basin manufacturing capabilities provides a competitive advantage. We also believe our expertise in water management provides a competitive advantage that allows us to assess and optimize our chemical solutions in a unique manner.
Segment Synergies
The expansion of our Water Infrastructure segment directly enhances the revenue-generating potential of our Water Services segment by creating synergies between physical assets and service operations. New pipeline and recycling systems trigger increased demand for Water Transfer work, as customers rely on comprehensive solutions to efficiently move water to and from operational sites. Similarly, additional disposal facilities lead to greater opportunities for Fluids Hauling, leveraging preferred access and cost efficiencies associated with handling higher volumes. By integrating advanced infrastructure with flexible service capabilities, the Company maximizes value for clients, drives operational efficiency, and unlocks new opportunities for long-term contracts and increased market share. Our recycling operations use emulsion polymers manufactured by our Chemical Technologies segment for water treatment. The emulsion polymers help separate the solids from the liquids in the water.
Significant Customers
There was one customer that accounted for 10% of our consolidated revenues for the year ended December 31, 2025.
Business Development, Sales and Marketing
We direct our business development and sales activities through a network of business development personnel and sales representatives, which allows us to support our customers at both the field and corporate level. Our sales
23
representatives work closely with local operations managers to target potential opportunities through strategic focus and regular customer interaction. We track the drilling and completion activities of our current and potential new customers. Our operations managers meet with our business development and sales team members several times a week, and monitor sales activity via regular reporting. To support our business development and sales strategy, we have developed a proprietary database that integrates market information such as current rig, completion crew and permit activity from both direct and third party sources and the location of our strategic sources, infrastructure assets and networks with our internal water balancing models utilizing projected volumes flowing both into and out of our water networks and recycling and disposal facilities.
Our marketing activities are performed by an internal marketing group with input from key executives. We intend to build and maintain a well-recognized brand in the oil and gas industry through multiple media outlets, including our website and social media accounts, print and billboard advertisements, presenting at and participating in various industry-specific conferences, case studies, publications and lectures.
Environmental and Occupational Safety and Health Matters
Our water-related operations in support of energy development and production activities pursued by our customers are subject to stringent and comprehensive federal, tribal, state and local laws and regulations in the U.S. governing occupational safety and health, the discharge of materials into the environment and environmental protection. Numerous governmental entities, including the EPA, the U.S. Occupational Safety and Health Administration (“OSHA”) and analogous state agencies, have the power to enforce compliance with these laws and regulations and the permits issued under them, often requiring difficult and costly actions. These laws and regulations may, among other things (i) require the acquisition of permits or other approvals to take fresh water from surface water and groundwater, construct pipelines or containment facilities, drill wells and other regulated activities; (ii) restrict the types, quantities and concentration of various substances that can be released into the environment or injected into non-producing belowground formations; (iii) limit or prohibit our operations on certain lands lying within wilderness, wetlands and other protected areas; (iv) require remedial measures to mitigate pollution from former and ongoing operations; (v) impose specific safety and health criteria addressing worker protection; and (vi) impose substantial liabilities for pollution resulting from our operations. Any failure to comply with these laws and regulations may result in the assessment of sanctions, including administrative, civil and criminal penalties, the imposition of investigatory, remedial or corrective action obligations or the incurrence of capital expenditures; the occurrence of restrictions, delays or cancellations in the permitting, performance or expansion of projects; and the issuance of orders enjoining performance of some or all of our operations in a particular area.
Our business activities present risks of incurring significant environmental costs and liabilities, including costs and liabilities resulting from our handling of oilfield and other wastes, because of potential air emissions and wastewater discharges related to our operations, and due to historical oilfield industry operations and waste disposal practices. Our businesses include the operation of oilfield waste disposal injection wells that pose risks of environmental liability, including leakage from the wells to surface or subsurface soils, surface water or groundwater. In addition, private parties, including the owners of properties upon which we perform services and facilities where our wastes are taken for reclamation or disposal, also may have the right to pursue legal actions to enforce compliance as well as to seek damages for non-compliance with environmental laws and regulations or for personal injury or property or natural resource damages. Some environmental laws and regulations may impose strict liability, which means that in some situations we could be exposed to liability as a result of our conduct that was lawful at the time it occurred or the conduct of, or conditions caused by, prior operators or other third parties.
The trend in U.S. environmental regulation is typically to place more restrictions and limitations on activities that may affect the environment. Moreover, accidental releases or spills may occur in the course of our operations, and we cannot assure you that we will not incur significant costs and liabilities as a result of such releases or spills, including any third-party claims for damage to property, natural resources or persons. Historically, our environmental compliance costs in the U.S. have not had a material adverse effect on our results of operations; however, there can be no assurance that such costs will not be material in the future or that such future compliance will not have a material adverse effect on our business and operational results. Our customers may also incur increased costs or restrictions, delays or cancellations in permitting or operating activities as a result of more stringent environmental laws and regulations, which may result in
24
curtailment of exploration, development or production activities that would reduce the demand for our services. Any new laws and regulations, amendment of existing laws and regulations, reinterpretation of legal requirements or increased governmental enforcement that result in more stringent and costly construction, completion or water-management activities, waste handling, storage transport, disposal, or remediation requirements or increased climate-related restrictions on our customers’ operations could have a material adverse effect on our financial position and results of operations. We may be unable to pass on such increased compliance costs to our customers.
The following is a summary of the more significant existing environmental and occupational safety and health laws in the U.S., as amended from time to time, to which our operations are subject and for which compliance may have a material adverse impact on our capital expenditures, results of operations or financial position.
Hazardous substances and wastes. The federal Resource Conservation and Recovery Act (“RCRA”), and comparable state statutes regulate the generation, transportation, treatment, storage, disposal and cleanup of hazardous and non-hazardous wastes. Pursuant to rules issued by the EPA, the individual states administer some or all of the provisions of RCRA, sometimes in conjunction with their own, more stringent requirements. Drilling fluids, produced waters, and most of the other wastes associated with the exploration, development, and production of oil or gas, if properly handled, are currently exempt from regulation as hazardous waste under RCRA, and instead are regulated under RCRA’s less stringent non-hazardous waste provisions, state laws or other federal laws. However, it is possible that certain oil and gas drilling and production wastes now classified as non-hazardous could be classified as hazardous wastes in the future. Any loss of the RCRA exclusion for drilling fluids, produced waters and related wastes could result in an increase in our and our oil and gas producing customers’ costs to manage and dispose of generated wastes, which could have a material adverse effect on our and our customers’ results of operations and financial position. In the course of our operations, we generate some amounts of ordinary industrial wastes, such as paint wastes, waste solvents and waste oils that may be regulated as hazardous wastes.
Wastes containing naturally occurring radioactive material (“NORM”) may also be generated in connection with our operations. Certain processes used to produce oil and gas may enhance the radioactivity of NORM, which may be present in oilfield wastes. NORM is subject primarily to individual state radiation control regulations. In addition, NORM handling and management activities are governed by regulations promulgated by the OSHA. These state and OSHA regulations impose certain requirements concerning worker protection, the treatment, storage and disposal of NORM waste, the management of waste piles, containers and tanks containing NORM, as well as restrictions on the uses of land with NORM contamination.
The federal Comprehensive Environmental Response, Compensation and Liability Act (“CERCLA”), also known as the Superfund law, and comparable state laws impose liability, without regard to fault or legality of conduct, on classes of persons considered to be responsible for the release of a “hazardous substance” into the environment. These persons include the current and past owner or operator of the site where the hazardous substance release occurred and anyone who transported, disposed or arranged for the transport or disposal of a hazardous substance released at the site. Under CERCLA, such persons may be subject to strict, joint and several, liability for the costs of cleaning up the hazardous substances that have been released into the environment, for damages to natural resources and for the costs of certain health studies. CERCLA also authorizes the EPA and, in some instances, third parties to act in response to threats to the public health or the environment and to seek to recover from the responsible classes of persons the costs they incur. In addition, neighboring landowners and other third parties may file claims for personal injury and property damage allegedly caused by the hazardous substances released into the environment. We generate materials in the course of our operations that may be regulated as hazardous substances.
We currently own, lease, or operate numerous properties that have been used for activities supporting oil and gas exploration, development and production for a number of years. Although we believe that we have utilized operating and waste disposal practices that were standard in the industry at the time, hazardous substances, wastes, or petroleum hydrocarbons may have been released on, under or from the properties owned or leased by us, or on, under or from other locations, including off-site locations, where we conduct services for our customers or where such substances have been taken for treatment or disposal. In addition, some of our properties have been operated by third parties or by previous owners or operators whose treatment and disposal of hazardous substances, wastes, or petroleum hydrocarbons was not under our control. These properties and the substances disposed or released on, under or from them may be subject to
25
CERCLA, RCRA and analogous state laws. Under such laws, we could be required to undertake response actions or corrective measures, which could include removal of previously disposed substances and wastes, cleanup of contaminated property or performance of remedial actions to prevent future contamination, the costs of which could be material.
Water discharges and use. The Federal Water Pollution Control Act, also known as the Clean Water Act (“CWA”), and analogous state laws, impose restrictions and strict controls with respect to the discharge of pollutants, including spills and leaks of oil and hazardous substances, into state waters and waters of the U.S. The discharge of pollutants into regulated waters is prohibited, except in accordance with the terms of a permit issued by the EPA or an analogous state agency. Spill prevention, control and countermeasure plan requirements imposed under the CWA require appropriate containment berms and similar structures to help prevent the contamination of navigable waters in the event of a petroleum hydrocarbon tank spill, rupture or leak. In addition, the CWA and analogous state laws require individual permits or coverage under general permits for discharges of stormwater runoff from certain types of facilities.
The CWA also prohibits the discharge of dredge and fill material in regulated waters, including wetlands, unless authorized by permit. There continues to be uncertainty regarding the federal government’s applicable jurisdictional reach under the CWA over waters of the U.S. (“WOTUS”), including wetlands, as the EPA and the U.S. Army Corps of Engineers (“Corps”) have pursued multiple rulemakings since 2015 in an attempt to determine the scope of such reach. Following legal action on a January 2023 final rule, the U.S. Supreme Court’s decision in Sackett v. EPA, and the enactment of a subsequent September 2023 rule, the implementation of the definition of WOTUS is split based on jurisdiction, with the new rule enjoined in 26 states and being implemented in the remaining 24. In November 2025, the EPA and the Corps issued a proposed rule to further narrow the definition of WOTUS and expand certain exemptions, though the substance and timing of any final action cannot be predicted. To the extent that any new final rule or future rules issued by the EPA and Corps expand the scope of the CWA’s jurisdiction in areas where we or our customers conduct operations, such developments could increase compliance expenditures or mitigation costs, contribute to delays, restrictions, or cessation of the development of projects, and also reduce the rate of production of natural gas or crude oil from operators with whom we have a business relationship and, in turn, have a material adverse effect on our business, results of operations and cash flows. Federal and state regulatory agencies can impose administrative, civil and criminal penalties for non-compliance with discharge permits or other requirements of the CWA and analogous state laws and regulations.
The Oil Pollution Act of 1990 (“OPA”) amends the CWA and sets minimum standards for prevention, containment and cleanup of oil spills in WOTUS. The OPA applies to vessels, offshore facilities, and onshore facilities, including E&P facilities that may affect WOTUS. Under the OPA, responsible parties including owners and operators of onshore facilities may be held strictly liable for oil cleanup costs and natural resource damages as well as a variety of public and private damages that may result from oil spills. The OPA also currently limits the liability of a responsible party for economic damages, excluding all oil spill response costs, to $137.7 million; although this limit does not apply if the spill was caused by gross negligence or willful misconduct, resulted from a violation of a federal safety, construction or operating regulation, or if the party failed to report a spill or cooperate fully in the cleanup. The OPA also requires owners or operators of certain onshore facilities to prepare Facility Response Plans for responding to a worst-case discharge of oil into WOTUS.
Saltwater disposal wells and induced seismicity. Saltwater disposal via underground injection is regulated pursuant to the Underground Injection Control (“UIC”) program established under the federal Safe Drinking Water Act (the “SDWA”) and analogous state and local laws and regulations. The UIC program includes requirements for permitting, testing, monitoring, recordkeeping and reporting of injection well activities, as well as a prohibition against the migration of fluid containing any contaminant into underground sources of drinking water. State regulations require a permit from the applicable regulatory agencies to operate underground injection wells. Although we monitor the injection process of our wells, any leakage from the subsurface portions of the injection wells could cause degradation of fresh groundwater resources, potentially resulting in suspension of our UIC permit, issuance of fines and penalties from governmental agencies, incurrence of expenditures for remediation of the affected resource and imposition of liability by third parties claiming damages for alternative water supplies, property and personal injuries. A change in UIC disposal well regulations or the inability to obtain permits for new disposal wells in the future may affect our ability to dispose of produced waters and other substances, which could affect our business.
26
Furthermore, in response to seismic events in the past several years near underground disposal wells used for the disposal by injection of produced water resulting from oil and gas activities, federal and some state agencies have investigated and may continue investigating whether such wells have caused increased seismic activity, and some states have restricted, suspended or shut down the use of such disposal wells in certain areas prone to increased seismic activity. Developing research suggests that the link between seismic activity and wastewater disposal may vary by region and that only a very small fraction of the tens of thousands of injection wells have been suspected to be, or have been, the likely cause of induced seismicity. In 2016, the U.S. Geological Survey identified six states with the most significant hazards from induced seismicity, including Oklahoma, Kansas, Texas, Colorado, New Mexico and Arkansas. As a result of these concerns, regulators in some states have imposed, or are considering imposing, additional requirements in the permitting of produced water disposal wells or otherwise to assess any relationship between seismicity and the use of such wells. For example, Oklahoma has issued rules for wastewater disposal wells that imposed certain permitting and operating restrictions and reporting requirements on disposal wells in proximity to faults. The Texas Railroad Commission adopted similar rules in Texas. States such as Texas and Oklahoma have, from time to time, suspended hydraulic fracturing or injection disposal operations or called for reduced volumes in response to seismic activity, and similar actions may be taken by these states or others in the future.
An additional consequence of this seismic activity is lawsuits alleging that disposal well operations have caused damage to neighboring properties or otherwise violated state and federal rules regulating waste disposal. The adoption and implementation of any new laws, regulations or directives that restrict our ability to dispose of wastewater gathered from our customers by limiting volumes, disposal rates, disposal well locations or otherwise, or requiring us to shut down disposal wells, could have a material adverse effect on our business, financial condition, and results of operations.
Hydraulic fracturing activities. Hydraulic fracturing involves the injection of water, sand or other proppants and chemical additives under pressure into targeted geological formations to fracture the surrounding rock and stimulate production. Hydraulic fracturing is an important and common practice that is typically regulated by state oil and natural gas commissions or similar agencies. However, the practice continues to be controversial in certain parts of the country, resulting in increased scrutiny and regulation of the hydraulic fracturing process, including by federal agencies that have asserted regulatory authority or pursued investigations over certain aspects of the hydraulic fracturing process. For example, the EPA has asserted regulatory authority pursuant to the SDWA UIC program over hydraulic fracturing activities involving the use of diesel and issued guidance covering such activities. New regulations may be considered in the future, including limiting water withdrawals and usage, limiting water disposition, or restricting which additives may be used. Any of these regulatory efforts could significantly increase capital, compliance and operating costs, as well as delay or halt the operations of our customers, which, in turn, could have a material adverse effect on our business, financial condition and results of operations.
Previous administrations have at times also called for revisions and restrictions to the leasing and permitting programs for oil and gas development on federal lands and, for a time, suspended federal oil and gas leasing activities. In April 2024, the Bureau of Land Management (“BLM”) finalized a rule that limits flaring from well sites on federal lands, among other requirements. Litigation challenging the rule is currently held in abeyance while the Trump Administration considers revisions to the rule. In November 2025, the BLM announced it would delay enforcement of certain regulatory compliance deadlines under the rule while it is under reconsideration.
Moreover, some state and local governments have adopted, and other governmental entities are considering adopting, regulations that could impose more stringent permitting, disclosure and well-construction requirements on hydraulic fracturing operations, including states where we or our customers operate. For example, Texas, Oklahoma, California, Ohio, Pennsylvania and North Dakota, among others, have adopted regulations that impose stringent permitting, disclosure, disposal and well-construction requirements on hydraulic fracturing operations. States could also elect to place certain prohibitions on hydraulic fracturing. In addition to state laws, local land use restrictions, such as city ordinances, may restrict drilling in general and/or hydraulic fracturing in particular, as certain local governments in California have done. Other states, such as Texas, Oklahoma and Ohio have taken steps to limit the authority of local governments to regulate oil and gas development.
In the event that new federal, state or local restrictions or bans on the hydraulic fracturing process are adopted in areas where we or our customers conduct business, we or our customers may incur additional costs or permitting
27
requirements to comply with such requirements that may be significant in nature and our customers could experience added costs, restrictions, delays or cancellations in their exploration, development, or production activities, which would in turn reduce the demand for our services and have a material adverse effect on our liquidity, consolidated results of operations, and consolidated financial condition.
Air Emissions. The U.S. Clean Air Act (“CAA”) and comparable state laws restrict the emission of air pollutants from many sources through air emissions standards, construction and operating permit programs and the imposition of other compliance standards. These laws and regulations may require us to obtain pre-approval for the construction or modification of certain projects or facilities expected to produce or significantly increase air emissions, obtain and strictly comply with stringent air permit requirements or utilize specific equipment or technologies to control emissions of certain pollutants. The need to obtain permits has the potential to delay our projects as well as our customers’ development of oil and gas projects. We or our customers may incur certain capital expenditures for air pollution control equipment or other air emissions-related issues. For example, in 2020, the EPA under the Trump Administration published a final action that, upon conducting a periodic review of the ozone standard in accord with CAA requirements, elected to retain the 2015 ozone NAAQS without revision on a going-forward basis. In March 2025, the EPA announced a reconsideration of the ozone NAAQS. We cannot predict what further actions, if any, or on what timeline, the EPA may take with respect to these standards. State implementation of the revised NAAQS could also result in the imposition of more stringent requirements. Compliance with the NAAQS requirements or other air pollution control and permitting requirements has the potential to delay the development of oil and gas projects and increase our or our customers’ costs of development and production, which costs could reduce demand for our services and have a material adverse impact on our business and results of operations.
Climate Change. The issue of climate change continues to attract considerable attention from the public and policymakers in the U.S. and around the world. Numerous proposals have been made at the international, national, regional and state levels of government to monitor and limit existing emissions of greenhouse gases (“GHGs”) as well as to restrict or eliminate such future emissions. As a result, our operations as well as the operations of our oil and natural gas E&P customers are subject to a series of regulatory, political, litigation, and financial risks associated with the production and processing of fossil fuels and emission of GHGs.
In the U.S., no comprehensive climate change legislation has been implemented at the federal level. Federal regulatory initiatives have focused on, among other things, establishing construction and operating permit reviews for GHG emissions from certain large stationary sources, requiring the monitoring and annual reporting of GHG emissions from certain petroleum and natural gas system sources, and reducing methane emissions from oil and gas production and natural gas processing and transmission operations through limitations on venting and flaring and the implementation of enhanced emission leak detection and repair requirements. However, following the change in U.S. presidential administrations, proposals have been made to repeal or otherwise modify these requirements and the EPA’s GHG “Endangerment Finding,” which underpins the majority of the EPA’s GHG regulations. In February 2026, the Trump Administration finalized a rule repealing the Endangerment Finding. Such proposals are still under consideration and are subject to a number of uncertainties and likely could face legal challenges that would further delay the implementation of any rules and we cannot predict the ultimate outcome. Further, in recent years, there has been considerable uncertainty surrounding regulation of methane emissions. In December 2023, the EPA finalized a rule that established more stringent Quad Ob new source and Quad Oc first-time existing source standards of performance for methane and volatile organic compound (“VOC”) emissions in the crude oil and natural gas source category. However, in March 2025, the EPA announced plans to reconsider Quad Ob and Quad Oc, and in November 2025, the EPA finalized an interim final rule extending the compliance deadlines for certain provisions provided in the 2023 rules. Litigation challenging the EPA’s final interim rule extending such compliance deadlines for new and existing oil and gas sources remains pending.
In August 2022, the IRA 2022 was signed into law. This law, among other provisions, amended the CAA to establish a Waste Emissions Charge for methane emissions in excess of statutory thresholds from sources required to report their GHG emissions to the EPA, including certain oil and gas operations and appropriated significant federal funding for renewable energy initiatives. However, in February 2025, Congress repealed the Waste Emissions Charge rule using the Congressional Review Act, and the OBBBA delayed implementation of the charge until 2034. While the EPA cannot reissue its rule implementing the Waste Emissions Charge (either in substantially the same form or in a new rule), the underlying requirement in the IRA 2022 remains unchanged. We cannot predict if the Trump Administration and/or Congress may take action to repeal or revise this requirement in the IRA 2022. However, compliance with this
28
and other air pollution control and permitting requirements could increase our customers’ operating costs and adversely affect their business, thereby reducing demand for our services.
Separately, various states and groups of states have adopted or are considering adopting legislation, regulations or other regulatory initiatives that are focused on such areas as GHG cap and trade programs, carbon taxes, reporting and tracking programs, and restriction of emissions. For example, Colorado has begun to increasingly regulate oil and gas operations with consideration towards GHG emissions and cumulative impacts of oil and gas development. In January 2024, the Colorado Energy and Carbon Management Commission (formerly the Colorado Oil and Gas Conservation Commission) adopted final rules that would apply increased scrutiny to the cumulative impacts of GHG emissions of oil and gas development and set GHG emissions intensity targets for oil and gas operators.
Litigation risks related to climate change are also increasing, as a number of states, municipalities and other plaintiffs have sought to bring suit against the largest oil and natural gas exploration and production companies in state or federal court, alleging, among other things, that such companies created public nuisances by producing fuels that contributed to global warming effects, such as rising sea levels, and therefore are responsible for roadway and infrastructure damages as a result, or alleging that the companies have been aware of the adverse effects of climate change for some time but defrauded their investors by failing to adequately disclose those impacts.
Moreover, access to capital by fossil fuel producers as well as other companies supporting the oil and gas industry may be impacted by climate change policies. Stockholders and bondholders currently invested in fossil fuel energy companies but concerned about the potential effects of climate change may elect in the future to shift some or all of their investments into non-fossil fuel energy related sectors. While we cannot predict what policies may result from this, a material reduction in the capital available to the fossil fuel industry could make it more difficult to secure funding for exploration, development, production, transportation, and processing activities, which could reduce demand for our services.
In addition, the SEC has considered and certain states have enacted or are otherwise considering disclosure requirements for certain climate-related risks. Enhanced climate-related disclosure requirements could increase our operating costs and lead to reputational or other harm with customers, regulators, or other stakeholders to the extent our disclosures do not meet their own standards or expectations. Consequently, we are also exposed to increased litigation risks relating to alleged climate-related damages resulting from our operations, statements alleged to have been made by us or others in our industry regarding climate change risks, or in connection with any future disclosures we may make regarding reported emissions, particularly given the inherent uncertainties and estimations with respect to calculating and reporting GHG emissions.
Finally, increasing concentrations of GHGs in the Earth's atmosphere may produce climate changes that have significant physical effects, such as increased frequency and severity of storms, droughts, floods, rising sea levels and other climatic events, as well as chronic shifts in temperature and precipitation patterns. These climatic developments have the potential to cause physical damage to our assets and thus could have an adverse effect on our operations. Additionally, changing meteorological conditions, particularly temperature, may result in changes to the amount, timing, or location of demand for energy or our solutions. While our consideration of changing climatic conditions and inclusion of safety factors in design is intended to reduce the uncertainties that climate change and other events may potentially introduce, our ability to mitigate the adverse impacts of these events depends in part on the effectiveness of our facilities and our disaster preparedness and response and business continuity planning, which we may not have considered or be prepared for every eventuality.
Endangered Species. The federal Endangered Species Act (the “ESA”) restricts activities that may affect endangered or threatened species or their habitats. Similar protections are offered to migratory birds under the federal Migratory Bird Treaty Act (the “MBTA”). To the degree that species listed under the ESA or similar state laws, or are protected under the MBTA, live in the areas where we or our oil and gas producing customers operate, our and our customers’ abilities to conduct or expand operations and construct facilities could be limited or be forced to incur material additional costs. Moreover, our customers’ drilling activities may be delayed, restricted, or cancelled in protected habitat areas or during certain seasons, such as breeding and nesting seasons. Some of our operations and the operations of our customers are located in areas that are designated as habitats for protected species. In addition, the FWS may make determinations on the listing of unlisted species as endangered or threatened under the ESA. For
29
example, listings of the dunes sagebrush lizard and lesser prairie chicken as threatened or endangered may impact our or our customers’ operations. The designation of previously unidentified endangered or threatened species could indirectly cause us to incur additional costs, cause our or our oil and gas producing customers’ operations to become subject to operating restrictions or bans and limit future development activity in affected areas. The FWS and similar state agencies may designate critical or suitable habitat areas that they believe are necessary for the survival of threatened or endangered species. Such a designation could materially restrict use of or access to federal, state, and private lands.
Chemical Safety. We are subject to a wide array of laws and regulations governing chemicals, including the regulation of chemical substances and inventories, such as TSCA in the U.S. These laws and regulations change frequently and have the potential to limit or ban altogether the types of chemicals we may use in our products, as well as result in increased costs related to testing, storing, and transporting our products prior to providing them to our customers. For example, the TSCA requires all chemicals in commerce to undergo a safety review and also requires safety findings before a new chemical can enter the market. Any new restrictions on the development of new products, increases in regulation, or disclosure of confidential, competitive information could have an adverse effect on our operations and our cost of doing business.
Furthermore, governmental, regulatory and societal demands for increasing levels of product safety and environmental protection could result in increased pressure for more stringent regulatory control with respect to the chemical industry. These concerns could influence public perceptions regarding our products and operations, the viability of certain products, our reputation, the cost to comply with regulations, and the ability to attract and retain employees. Moreover, changes in environmental, health and safety regulations could inhibit or interrupt our operations, or require us to modify our facilities or operations. Accordingly, environmental or regulatory matters may cause us to incur significant unanticipated losses, costs or liabilities, which could reduce our profitability.
Occupational Safety and Health and other legal requirements. We are subject to the requirements of the federal Occupational Safety and Health Act and comparable state statutes whose purpose is to protect the health and safety of workers. In addition, the OSHA’s hazard communication standard, the EPA’s Emergency Planning and Community Right-to-Know Act and comparable state regulations and any implementing regulations require that we organize and/or disclose information about hazardous materials used or produced in our operations and that this information be provided to employees, state and local governmental authorities and citizens. We have an internal program of inspection designed to monitor and enforce compliance with worker safety requirements.
In addition, as part of the services we provide, we operate as a motor carrier and therefore are subject to regulation by the U.S. Department of Transportation (“U.S. DOT”) and analogous state agencies. These regulatory authorities exercise broad powers, governing activities such as the authorization to engage in motor carrier operations, regulatory safety, and hazardous materials labeling, placarding and marking. There are additional regulations specifically relating to the trucking industry, including testing and specification of equipment and product handling requirements. The trucking industry is subject to possible regulatory and legislative changes that may affect the economics of the industry by requiring changes in operating practices or by changing the demand for common or contract carrier services or the cost of providing truckload services. From time to time, various legislative proposals are introduced, including proposals to increase federal, state or local taxes on motor fuels, among other things, which may increase our costs or adversely impact the recruitment of drivers. We cannot predict whether, or in what form, any increase in such taxes applicable to us will be enacted.
Seasonality
Our results of operations have historically been adversely affected by seasonal declines in the activity levels of our customers, typically in the fourth quarter, related to holidays, inclement winter weather and in some years the exhaustion of our customers’ annual drilling and completions capital expenditure budgets.
Intellectual Property
Protection of our products and processes is important to our businesses. We own numerous patents and, where appropriate, we file patent applications for new products and technologies. For example, we use our AquaView® technology to quantify volumes and flow rates to verify current and potential water availability and volumes when
30
analyzing a new water source. We also currently own multiple U.S. patents relating to completions technology including borate cross-linkers, slurry monitoring systems and others. We also have a robust program to seek patents on new developments.
We have a meaningful backlog of pending patents, including a proprietary water analytics and automation tool, as well as creating fracturing fluids with produced water, evaporation methodologies, cross-linker/breaker mechanisms and liquid distribution metering systems. While a presumption of validity exists with respect to issued U.S. patents, we cannot assure that any of our patents will not be challenged, invalidated, circumvented or rendered unenforceable. Furthermore, we cannot assure the issuance of any pending patent application, or that if patents do issue, that these patents will provide meaningful protection against competitors or against competitive technologies. Additionally, our competitors or other third parties may obtain patents that restrict or preclude our ability to lawfully produce or sell our products in a competitive manner.
We also rely upon continuing technological innovation and trade secrets to develop and maintain our competitive position. There can be no assurance that confidentiality and other agreements into which we enter and have entered will not be breached, that these agreements will provide meaningful protection for our trade secrets or proprietary know-how, or that adequate remedies will be available in the event of an unauthorized use or disclosure of such trade secrets and know-how. In addition, there can be no assurance that others will not obtain knowledge of these trade secrets through independent development or other access by legal means.
We also own a number of trademarks, which we use in connection with our businesses. In addition to protections through federal registration, we also rely on state common law protections to protect our brand. There can be no assurance that the trademark registrations will provide meaningful protection against the use of similar trademarks by competitors, or that the value of our trademarks will not be diluted.
Because of the breadth and nature of our intellectual property rights and our business, we do not believe that any single intellectual property right (other than certain trademarks for which we intend to maintain the applicable registrations) is material to our business. Moreover, we do not believe that the termination of intellectual property rights expected to occur over the next several years, either individually or in the aggregate, will materially adversely affect our business, financial condition or results of operations.
Risk Management and Insurance
Our operations are subject to hazards inherent in the oil and gas industry, including accidents, blowouts, explosions, craterings, fires, oil spills and hazardous materials spills. These conditions can cause:
| ● | personal injury or loss of life; |
| ● | damage to, or destruction of, property, the environment and wildlife; and |
| ● | the suspension of our or our customers’ operations. |
In addition, claims for loss of oil and gas production and damage to formations can occur in the well services industry. If a serious accident were to occur at a location where our equipment and services are being used, it could result in us being named as a defendant in lawsuits asserting large claims.
Because our business involves the transportation of heavy equipment, freight and materials, we may also experience traffic accidents, which may result in spills, property damage and personal injury.
Despite our efforts to maintain high safety standards, including the installation of vehicle surveillance systems, from time to time we have suffered accidents, and there is a risk that we will experience accidents in the future. In addition to the property and personal losses from these accidents, the frequency and severity of these incidents affect our operating costs and insurability, and our relationship with customers, employees and regulatory agencies. In particular,
31
in recent years many of our large customers have placed an increased emphasis on the safety records of their service providers. Any significant increase in the frequency or severity of these incidents, or the general level of compensatory payments, could adversely affect the cost of, or our ability to obtain, workers’ compensation and other forms of insurance, and could have other material adverse effects on our financial condition and results of operations.
We maintain insurance coverage of types and amounts that we believe to be customary in the industry, including workers’ compensation, employer’s liability, sudden & accidental pollution, umbrella, directors & officers, comprehensive commercial general liability, business automobile and property, cybersecurity and equipment physical damage insurance. Our insurance coverage may be inadequate to cover our liabilities. In addition, we may not be able to maintain adequate insurance in the future at rates we consider reasonable and commercially justifiable or on terms as favorable as our current arrangements.
We enter into master services agreements (“MSAs”) with most of our customers. Our MSAs delineate our and our customer’s respective indemnification obligations with respect to the services we provide. Generally, under our MSAs, including those relating to our Water Services, Water Infrastructure, Chemical Technologies product sales, accommodations and rentals and completion and construction services, we assume responsibility for pollution or contamination originating above the surface from our equipment or handling of the equipment of others. However, our customers generally assume responsibility for all other pollution or contamination that may occur during operations, including that which may generally result from seepage or any other uncontrolled flow of drilling fluids. The assumed responsibilities include the control, removal and cleanup of any pollution or contamination. In such cases, we may be exposed to additional liability if we are grossly negligent or commit willful acts causing the pollution or contamination. Generally, our customers also agree to indemnify us against claims arising from the personal injury or death of the customers’ employees or those of the customers’ other contractors, in the case of our hydraulic fracturing operations, to the extent that such employees are injured by such operations, unless the loss is a result of our gross negligence or willful misconduct. Similarly, we generally agree to indemnify our customers for liabilities arising from personal injury to or death of any of our employees or employees of any of our subcontractors, unless resulting from the gross negligence or willful misconduct of our customer. The same principles apply to mutual indemnification for loss or destruction of customer-owned property or equipment, except such indemnification is not limited in an instance of gross negligence or willful misconduct. Losses arising from catastrophic events, such as blowouts, are generally the responsibility of the customer. However, despite this general allocation of risk, we may be unsuccessful in enforcing contractual terms, incur an unforeseen liability that is not addressed by the scope of the contractual provisions or be required to enter into an MSA with terms that vary from our standard allocations of risk, as described above. Consequently, we may incur substantial losses that could materially and adversely affect our financial condition and results of operations.
Available Information
We file or furnish annual, quarterly and current reports and other documents with the SEC under the Exchange Act. The SEC also maintains an internet website at www.sec.gov that contains reports, proxy and information statements and other information regarding issuers, including us, that file electronically with the SEC.
We also make available free of charge through our website, www.selectwater.com, electronic copies of certain documents that we file with the SEC, including our Annual Reports on Form 10-K, Quarterly Reports on Form 10-Q, Current Reports on Form 8-K and amendments to those reports filed or furnished pursuant to Section 13(a) or 15(d) of the Exchange Act as soon as reasonably practicable after we electronically file such material with, or furnish it to, the SEC. Information on our website is not a part of this Annual Report on Form 10-K.
ITEM 1A. RISK FACTORS
The following risks could affect our financial performance or could cause actual results to differ materially from estimates contained in our forward-looking statements. We may encounter risks in addition to those described below. Additional risks and uncertainties not currently known to us, or that we currently deem to be immaterial, may also impair or adversely affect our business, results of operation, financial condition and prospects.
32
Risks Related to Our Business Operations
Our business depends on capital spending by the oil and gas industry in the U.S. and reductions in capital spending could have a material adverse effect on our liquidity, results of operations and financial condition.
Demand for our services is directly affected by capital spending by our customers to explore for, develop and produce oil and gas in the U.S. Capital spending is generally dependent on our customers’ views of future demand for oil and gas and future oil and gas prices, as well as our customers’ ability to access capital. Such demand may be impacted by a variety of factors, including global geopolitical instability, accelerated substitution of renewable forms of energy for oil and gas and actions of OPEC+. During the year ended December 31, 2025, the average West Texas Intermediate (“WTI”) spot price was $65.39, versus an average price of $76.63 for the year ended December 31, 2024. Furthermore, this trend has continued into the first quarter of 2026 and we anticipate the resumption of Venezuelan hydrocarbon exports may further depress oil prices.
Volatility in oil prices or natural gas prices (or the perception that oil prices or natural gas prices will decrease) affects the spending patterns of our customers and may result in the drilling or completion of fewer new wells or lower spending on existing wells. This, in turn, could lead to lower demand for our services and may cause lower rates and lower utilization of our assets. While customer budgets for U.S. onshore development during 2025 were relatively flat on a year-over-year basis, and are expected to remain relatively so during 2026, factors outside of our control can alter these budgets, or lead customers to underspend their budgets. Even in an environment of strong oil and gas prices, fewer oil and gas well completions in our market areas as a result of decreased capital spending may have a negative long-term impact on our business. Any of these conditions or events could adversely affect our operating results and may continue to do so into the future. Sustained market uncertainty could also result in lower demand for our services, which could adversely affect our liquidity, results of operations and financial condition. While we believe that the current presidential administration will provide regulatory tailwinds for our industry, industry conditions are influenced by numerous factors over which we have no control, including, but not limited to those discussed in “Cautionary Note Regarding Forward-Looking Statements.”
Political instability or armed conflict in crude oil or natural gas producing regions could have a material adverse impact on our business, financial condition or future results.
Our business, financial condition and future results are subject to political and economic risks and uncertainties, including instability resulting from civil unrest, political demonstrations, mass strikes or armed conflict or other crises in crude oil or natural gas producing areas. For example, while there are currently broad-ranging economic sanctions on Russia and certain Russian individuals, banking entities and corporations as a response to the Russia-Ukraine war, an end to the Russia-Ukraine conflict and an easing or elimination of the related sanctions against Russia could result in a decrease in commodity prices as Russian hydrocarbons become more readily accessible on global markets, which could have an adverse effect on our customers and therefore adversely affect our customers’ demand for our services. In addition, the instability in the Middle East has contributed to volatility in oil and gas prices, as well as disruptions to supply chains. Further escalation of conflict in the Middle East, in particular with Iran, a major oil producer, could have an adverse effect on our customers and therefore adversely affect our customers’ demand for our services. Further, beginning in late 2025, the U.S. seized several oil tankers suspected of transporting oil from Venezuela, and, in early 2026, the U.S. launched a limited military intervention in Venezuela which culminated in the capture of Venezuela’s incumbent president. As the situation stabilizes and U.S.-Venezuela relations improve, it is expected that approximately 50 million barrels of sanctioned oil may become available for export as U.S. sanctions are lifted. The resumption of such exports may cause a depression in global oil prices as the market adjusts to such an increase in supply. If the resumption of oil exports from Venezuela depresses global oil prices, certain of our customers’ operations may no longer be economically viable, thereby reducing demand for our services. The ultimate geopolitical and macroeconomic consequences of these conflicts cannot be predicted, and such events could severely impact the world economy and may adversely affect our financial condition. Although the Company does not have operations overseas, these conflicts elevate the likelihood of supply chain disruptions, heightened volatility in crude oil and natural gas prices and negative effects on our ability to raise additional capital when required and could have a material adverse impact on our business, financial condition or future results.
33
OPEC+ policy decisions could have a material adverse impact on our business, financial condition or future results.
The actions of OPEC+ with respect to oil production cuts can have a significant impact on crude oil prices. Following several reductions in production cuts throughout 2025, on November 30, 2025, OPEC+ announced it would maintain current oil production cuts of approximately 3.2 million barrels per day and reaffirmed its decision to not increase production. Due to the above and other factors, crude oil and natural gas prices experienced increased levels of volatility during 2025, ranging from a low of $55.44 per barrel in September to a high of $80.73 per barrel in April. Further, the volatility in crude oil and natural gas prices could accelerate a transition away from fossil fuels, resulting in reduced demand over the longer term. To what extent these and other external factors (such as government action with respect to climate change regulation) ultimately impact our future business, liquidity, financial condition, and results of operations is highly uncertain and dependent on numerous factors, including future developments, which are not within our control and cannot be accurately predicted.
The failure to successfully integrate acquired assets or operations in the expected time frame or at all may adversely affect our future results.
If we fail to integrate acquired properties and successfully combine our business with the businesses of such acquired properties, the anticipated benefits of such acquisitions may not be realized fully or at all or may take longer to realize than expected. In addition, the actual integration may result in additional and unforeseen expenses, which could reduce the anticipated benefits of such acquisitions.
It is possible that the integration process could result in the loss of key employees, as well as the disruption of our ongoing businesses or inconsistencies in our standards, controls, procedures and policies. Any or all of those occurrences could adversely affect our ability to maintain relationships with customers and employees or to achieve the anticipated benefits of our acquisition activities. Integration efforts will also divert management attention and resources. These integration matters could have an adverse effect on us.
Changes in U.S. and international trade policies, such as the imposition of tariffs, particularly involving China, may adversely impact our business and operating results.
Though a comprehensive trade agreement was signed in 2020 between the U.S. and China, a trade war has rapidly escalated in the first half of 2025, with current tariffs on goods imported from China into the U.S. at a blended average tariff rate of approximately 48% and goods from the U.S. imported into China at an average tariff rate of approximately 32%. Approximately 8% of the raw material feedstock for our chemicals we produced in 2025 originated in China and were sold to us by our supplier partners. As a result, tariffs incurred by our supplier partners could increase our costs significantly and reduce profitability. Such elevated tariff rates may substantially increase the costs for certain products Select sources and, more importantly, our customers source from China, while also effectively pricing out U.S. oil, natural gas and NGLs from the Chinese market, which may adversely affect our customers as China is a major importer of oil, natural gas and NGLs globally. The continuation, expansion or worsening of these tariffs may adversely affect the industry in which we operate and reduce demand for our services. Further, the escalating trade war has resulted in a suspension of China’s imports of U.S. natural gas. As the world’s largest importer of natural gas, the loss of access to the market could have an adverse effect on our customers’ operations and the demand for their products.
Additionally, delays or interruptions in the supply of some chemicals for any reason could impact our ability to generate chemicals revenue. If we are forced to source chemicals currently originating in China from other countries, such compounds might be more expensive, inferior in quality, or take longer to source. If we incur higher costs that we cannot pass on to our customers or if we are unable to adequately replace the chemicals we currently source with chemicals produced elsewhere, our business could be adversely affected.
In addition to tariffs on Chinese imports, the U.S. administration has announced sweeping tariffs against a majority of other nations, with a universal 10% base tariff and a schedule of reciprocal tariffs. The U.S. is a major exporter of oil, gas and NGLs and may no longer be able to compete with global prices due to the tariffs on oil, gas and NGLs if other nations retaliate with their own tariffs, and such tariffs may reduce the demand for our customers’ products.
34
While the reciprocal tariffs imposed by the U.S. against many other nations are currently deferred, to the extent that any future U.S. trade policy results in retaliatory tariffs against the U.S., such as the escalated retaliatory tariffs with China, such developments could have an adverse effect on our customers’ business, and reduce demand for our services, which could have a material adverse effect on our business, results of operations and financial condition.
Approximately half of our revenues are derived from our operations in the Permian Basin of Texas and New Mexico, making us vulnerable to risks associated with geographic concentration generally and the Permian Basin specifically, including Basin-specific supply and demand factors, regulatory changes and severe weather impacts that could materially and adversely affect our business.
The Permian Basin of Texas and New Mexico is presently our largest operating region, accounting for approximately 51% and 48% of our revenue in 2025 and 2024, respectively. As a result of this concentration, we are vulnerable to risks associated with geographic concentration generally and the Permian Basin specifically. For example, we are disproportionately exposed to the impact in the Permian Basin of regional supply and demand factors, production delays or interruptions, as a result of governmental regulation or otherwise, processing or transportation capacity constraints, severe weather, market limitations, curtailment of production or interruption of the processing or transportation of produced oil and natural gas. Increased consolidation activity has occurred recently in the Permian Basin, which may lead to reductions in capital spending that could have an adverse effect on our business. In addition, the effect of fluctuations on supply and demand may become more pronounced within specific geographic oil and natural gas producing areas such as the Permian Basin, which may cause these conditions to occur with greater frequency or magnify the effects of these conditions. Due to the concentrated nature of our revenue-generating operations, we could experience any of the same conditions at the same time, resulting in a relatively greater impact on our revenue than they might have on other companies that have more geographically diverse revenue-generating operations.
Weather events that disproportionately impact the Permian Basin will adversely affect our results of operations as compared to our competitors that operate in other basins or that have more geographically diverse operations. Similarly, a significant portion of our current business relates to water and water-related services in the New Mexico portion of the Permian Basin. However, the future availability of, and/or access to, water in New Mexico will be affected by the results of a case, Texas v. New Mexico and Colorado, which is currently stayed pending further order by a special master. To the extent that this lawsuit is adversely decided against New Mexico, the state could, among other things, be required to provide more water downstream to Texas, which could reduce the availability of, and/or access to, water to existing or new water rights holders in New Mexico, resulting in limitations on our ability to obtain or maintain access to water for certain of our customers’ operations in New Mexico. The states reached a water-sharing agreement in 2022, which has been supported by the state of New Mexico, that determines an annual delivery amount for New Mexico and allows the state to accrue debt if it cannot make the annual delivery amount. However, this agreement was opposed by the federal government, and the parties are required to return to mediation in December 2024. The risk of any adverse development could reduce our ability to obtain or maintain access to water for our customers’ operations in the vicinity of our assets in New Mexico and have a corresponding adverse effect on our financial condition, results of operations and cash flows.
To the extent that the types of basin-specific events discussed above continue to arise or worsen, our operations and those of our customers may be materially and adversely affected.
Restrictions on the ability to procure water or changes in water sourcing or disposal requirements could add costs or decrease the demand for our water-related services.
Our business includes water transfer for use in our customers’ oil and gas E&P activities. Our access to the water we supply may be limited due to prolonged drought or our inability to acquire or maintain water sourcing permits or other rights. In addition, some state and local governmental authorities have begun to monitor or restrict the use of water subject to their jurisdiction for hydraulic fracturing to ensure adequate local water supply. For instance, some states require E&P companies to report certain information regarding the water they use for hydraulic fracturing and to
35
monitor the quality of groundwater surrounding some wells stimulated by hydraulic fracturing. Any such decrease in the availability of water, or demand for water services, could adversely affect our business and results of operations.
The adoption of more stringent trucking legislation or regulations may increase our costs and could have an adverse effect on our liquidity, results of operations, and financial condition.
In connection with the services we provide, we operate as a motor carrier and therefore are subject to regulation by the DOT and analogous state agencies, which govern such activities as the authorization to engage in motor carrier operations and regulatory safety. The trucking industry is subject to possible legislative and regulatory changes that may affect the economics of the industry by requiring changes in operating practices or by changing the demand for common or contract carrier services or the cost of providing truckload services.
Moreover, from time to time, various legislative proposals are introduced, including proposals to increase federal, state or local taxes, including taxes on motor fuels and environmental regulations pertaining to motor vehicles, which may increase our costs, limit our ability to utilize our trucks on schedule, require us to undertake repairs or sales of certain trucks or adversely affect the recruitment of drivers. Management cannot predict whether, or in what form, any increase in such taxes applicable to us will be enacted. We may be required to increase operating expenses or capital expenditures in order to comply with any new laws, regulations or other restrictions. See Part I, Item 1. “Business – Environmental and Occupational Safety and Health Matters” for more discussion on the DOT and associated trucking matters.
The IRA 2022 could accelerate the transition to new energy sources and could impose new costs on our customers’ operations.
In August 2022, IRA 2022 was signed into law and it contains hundreds of billions of dollars in incentives that a could accelerate the transition from the use of fossil fuels to alternative energy sources, which could decrease demand for oil and gas and consequently adversely affect the business of our customers, thereby reducing demand for our services. However, certain of these initiatives have been paused, repealed or otherwise modified by the Trump Administration and the passage of the OBBBA in July 2025. For example, the IRA 2022 amended the CAA to impose a Waste Emission Charge for methane emissions in excess of statutory thresholds from sources required to report their GHG emissions to the EPA, including those sources in the onshore petroleum and natural gas production and gathering and boosting source categories. However, in February 2025, Congress repealed the Waste Emissions Charge rule using the Congressional Review Act, and the OBBBA delayed implementation of the charge until 2034. While the EPA cannot reissue its rule implementing the Waste Emissions Charge (either in substantially the same form or in a new rule), the underlying requirement in the IRA 2022 remains unchanged. We cannot predict if the Trump Administration and/or Congress may take action to repeal or revise this requirement in the IRA 2022. To the extent similar initiatives or other air pollution control and permitting requirements are implemented in the future, such initiatives could increase our customers’ operating costs and adversely affect their businesses, thereby reducing demand for our services.
Additional fuel conservation measures, alternative fuel requirements and increased consumer demand for alternatives to oil and natural gas could reduce demand for oil and natural gas. The increased competitiveness of alternative energy sources, as such sources are developed, supported through government actions, improved and promoted, could reduce demand for hydrocarbons and therefore for our services, which would lead to a reduction in our revenues. The impact of declining demand for oil and natural gas may have a material adverse effect on our business, financial condition, prospects, results of operations and cash flows.
We may be unable to implement price increases or maintain existing prices on our core services.
We periodically seek to increase the prices on our services to offset rising costs and to improve returns on investment for our stockholders. However, we operate in a very competitive industry and as a result, we are not always successful in raising, or maintaining, our existing prices. Additionally, during periods of increased market demand, a significant amount of new service capacity, including new water transfer equipment, fluid hauling trucks and pipelines, may enter the market, which also puts pressure on the pricing of our services and limits our ability to increase prices.
36
Even when we are able to increase our prices, we may not be able to do so at a rate that is sufficient to offset rising costs, such as those resulting from heightened levels of inflation. In periods of high demand for oilfield services, a tighter labor market may result in higher labor costs. During such periods, our labor costs could increase at a greater rate than our ability to raise prices for our services. Also, we may not be able to successfully increase prices without adversely affecting our activity levels. The inability to maintain our pricing and to increase our pricing as costs increase could have a material adverse effect on our business, financial position and results of operations.
We may be subject to claims for personal injury and property damage, which could materially adversely affect our financial condition and results of operations.
We operate with most of our customers under MSAs. We endeavor to allocate potential liabilities and risks between the parties in the MSAs. Generally, under our MSAs, including those relating to our services, we assume responsibility for, including control and removal of, pollution or contamination that originates above the surface and originates from our equipment or services. Our customers generally assume responsibility for, including control and removal of, all other pollution or contamination that may occur during operations, including that which may result from seepage or any other uncontrolled flow of drilling fluids. We may have liability in such cases if we are negligent or commit willful acts. Generally, our customers also agree to indemnify us against claims arising from their employees’ personal injury or death to the extent that, in the case of our operations, their employees are injured or their properties are damaged by such operations unless resulting from our gross negligence or willful misconduct. Similarly, we generally agree to indemnify our customers for liabilities arising from personal injury to, or death of, any of our employees, unless resulting from gross negligence or willful misconduct of the customer. In addition, our customers generally agree to indemnify us for loss or destruction of customer-owned property or equipment and in turn, we agree to indemnify our customers for loss or destruction of property or equipment we own. Losses due to catastrophic events, such as blowouts, are generally the responsibility of the customer. However, despite this general allocation of risk, we might not succeed in enforcing such contractual allocation, might incur an unforeseen liability falling outside the scope of such allocation or may be required to enter into an MSA with terms that vary from the above allocations of risk. As a result, we may incur substantial losses, which could materially and adversely affect our financial condition and results of operations.
We operate in a highly competitive industry, which may intensify as our competitors expand their operations, thereby causing us to lose market share, and which could negatively affect our ability to expand our operations.
The oilfield water management business is highly competitive and includes numerous small companies capable of competing effectively in our markets on a local basis. Some of our larger diversified competitors have a similarly broad geographic scope, as well as greater financial and other resources than us, while others focus on specific basins only and may have locally competitive cost efficiencies as a result. Many of our larger competitors provide a broader base of services on a regional, national or worldwide basis. These companies may have a greater ability to continue oilfield service activities during periods of low commodity prices, to contract for equipment, to secure trained personnel, to secure contracts and permits and to absorb the burden of present and future federal, state, provincial, local and other laws and regulations (as applicable). Any inability to compete effectively with larger companies could have a material adverse impact on our financial condition and results of operations. Additionally, there may be new companies that enter our markets, or our existing and potential customers may choose to develop their own water management solutions. Our ability to maintain current revenue and cash flows, and our ability to expand our operations, could be adversely affected by the activities of our competitors and our customers. We may be unable to effectively compete if our competitors substantially increase the resources they devote to the development and marketing of the services that we offer, or substantially decrease the prices at which they offer their services. If our existing and potential customers develop their own water solutions, we may not be able to effectively replace that revenue. All of these competitive pressures could have a material adverse effect on our business, results of operations and financial condition.
Our operations involve risks that may increase our operating costs, which could reduce our profitability.
Although we take precautions to enhance the safety of our operations and minimize the risk of disruptions, our operations are subject to hazards inherent in the manufacturing and marketing of chemical and other products. These hazards include chemical spills, pipeline leaks and ruptures, storage tank leaks, discharges or releases of toxic or
37
hazardous substances or gases and other hazards incident to the manufacturing, processing, handling, transportation and storage of hazardous chemicals. We are also potentially subject to other hazards, including natural disasters and severe weather; explosions and fires; transportation problems, including interruptions, spills and leaks; mechanical failures; unscheduled downtimes; labor difficulties; remediation complications; and other risks. Many potential hazards can cause bodily injury and loss of life, severe damage to or destruction of property and equipment and environmental damage, and may result in suspension of operations and the imposition of civil or criminal penalties and liabilities. Furthermore, we are subject to present and future claims with respect to workplace exposure, exposure of contractors on our premises as well as other persons located nearby, workers’ compensation and other matters.
We maintain property, business interruption, products liability, cybersecurity and casualty insurance policies that we believe are in accordance with customary industry practices, as well as insurance policies covering other types of risks, including pollution legal liability insurance, but we are not fully insured against all potential hazards and risks incident to our business. Our operations are subject to hazards inherent in the oil and gas industry, such as, but not limited to, accidents, blowouts, explosions, craterings, fires, oil spills and releases of drilling, completion or fracturing fluids or wastewater into the environment. These conditions can cause: disruption in operations; substantial repair or remediation costs; personal injury or loss of human life; significant damage to or destruction of property, plant and equipment; environmental pollution, including groundwater contamination; impairment or suspension of operations; and substantial revenue loss.
We do not have insurance against all foreseeable risks, either because insurance is not available or because of the high premium costs. The occurrence of an event not fully insured against or the failure of an insurer to meet its insurance obligations could result in substantial losses. Our insurance policies are subject to customary exclusions, deductibles and coverage limits, in accordance with industry standards and practices. As a result of market conditions, premiums and deductibles for certain insurance policies can increase substantially and, in some instances, certain insurance may become unavailable or available only for reduced amounts of coverage. If we were to incur a significant liability for which we were not fully insured, it could have a material adverse effect on our business, results of operations, financial condition and liquidity. Any interruption in our services due to pipeline breakdowns or necessary maintenance or repairs could reduce sales revenues and earnings. In addition, claims for loss of oil and gas production and damage to formations can occur in the well services industry. Litigation arising from a catastrophic occurrence at a location where our equipment and services are being used may result in our being named as a defendant in lawsuits asserting large claims.
In addition, we are subject to various claims and litigation in the ordinary course of business. We are a party to various pending lawsuits and proceedings. For more information, see Part I, Item 3. “Legal Proceedings.”
Delays or restrictions in obtaining permits by us for our operations or by our E&P customers for their operations could impair our business.
Our operations and the operations of our E&P customers in most states require permits from one or more governmental agencies in order to perform drilling and completion activities, secure water rights, construct impoundment tanks and operate pipelines or trucking services. Such permits are typically issued by state agencies, but federal and local governmental permits may also be required. In addition, some of our customers’ drilling and completion activities in the U.S. may take place on federal land or Native American lands, requiring leases and other approvals from the federal government or Native American tribes to conduct such drilling and completion activities. Under certain circumstances, federal agencies may cancel proposed leases for federal lands and refuse to grant or delay required approvals. Moreover, additional rules and regulations on federal lands may impact our customers. For example, the BLM has finalized new rules that limit flaring from well sites on federal lands and add additional methane-related provisions to the permit application process, although litigation challenging these rules is held in abeyance while the Trump Administration reconsiders the rules. Any delay or denial of permits faced by our customers may impact demand for our services.
38
We are subject to cybersecurity risks. A cyber incident or systems failure could occur and result in information theft, data corruption, operational disruption and/or financial loss.
Our operations are increasingly dependent on digital technologies and services to conduct certain processing activities. We use these technologies for internal purposes, including data storage, processing and transmissions, as well as in our interactions with customers’ and suppliers’ products, services and technology. Digital technologies are subject to the risk of cybersecurity attacks. A cybersecurity incident could be caused by malicious insiders or third parties using sophisticated, targeted methods to circumvent firewalls, encryption, and other cybersecurity defenses, including hacking, fraud, trickery, or other forms of deception, as well as an unintentional event. Emerging artificial intelligence technologies may improve or expand the capabilities of malicious third parties in a way we cannot predict at this time, including being used to develop new hacking tools, exploit vulnerabilities, obscure malicious activities and increase the difficulty detecting threats. If our systems for protecting against cybersecurity risks prove not to be sufficient, we could be adversely affected by, among other things: loss of or damage to intellectual property, proprietary or confidential information, or customer, supplier, or employee data; interruption of our business operations; and increased costs required to prevent, respond to, or mitigate cybersecurity attacks. These risks could harm our reputation and our relationships with customers, suppliers, employees and other third parties, and may result in claims against us. These risks could have a material adverse impact on our business, results of operations and financial condition.
Technology advancements in well completion and service technologies, including those involving the replacement of water in fracturing fluid, could have a material adverse effect on our business, financial condition and results of operations.
The oilfield services industry is characterized by rapid and significant technological advancements and introductions of new products and services using new technologies. As competitors and others use or develop new technologies or technologies comparable to ours in the future, we may lose market share or be placed at a competitive disadvantage. For example, some oil and gas producers may be developing and utilizing non-water fracturing techniques, including those utilizing propane, carbon dioxide or nitrogen instead of water. Further, we may face competitive pressure to implement or acquire certain new technologies at a substantial cost. Some of our competitors may have greater financial, technical and personnel resources than we do, which may allow them to gain technological advantages or implement new technologies before we can. Additionally, we may be unable to implement new technologies or products at all, on a timely basis or at an acceptable cost. New technology could also make it easier for our customers to vertically integrate their operations or reduce the amount of waste produced in oil and gas drilling and production activities, thereby reducing or eliminating the need for third-party disposal. Limits on our ability to effectively use or implement new technologies may have a material adverse effect on our business, financial condition and results of operations.
We may be adversely affected by uncertainty in the global financial markets and a worldwide economic downturn.
Our future results may be impacted by uncertainty caused by a worldwide economic downturn, continued volatility or deterioration in the debt and equity capital markets, inflation, international conflicts, public health crises, deflation or other adverse economic conditions that may negatively affect us or parties with whom we do business resulting in a reduction in our customers’ spending and their non-payment or inability to perform obligations owed to us, such as the failure of customers to honor their commitments or the failure of major suppliers to complete orders. Additionally, credit market conditions may change, slowing our collection efforts as customers may experience increased difficulty in obtaining requisite financing, potentially leading to lost revenue and higher than normal accounts receivable. During times when the gas or crude oil markets weaken, our customers are more likely to experience financial difficulties, including being unable to access debt or equity financing. For example, elevated interest rates may prevent our customers from being able to obtain debt financing at favorable rates, or at all, which could result in a reduction in our customers’ spending for our services. In addition, in the course of our business we hold accounts receivable from our customers. In the event of the financial distress or bankruptcy of a customer, we could lose all or a portion of such outstanding accounts receivable associated with that customer. Further, all or a portion of our contracts could be cancelled at significant expense or loss of expected revenues to us if a customer was to enter into bankruptcy.
39
The current global economic environment may adversely impact our ability to issue debt, including due to high interest rates as a result of the monetary policy of the Federal Reserve. Any economic uncertainty may cause financial institutions to respond to their borrowers by increasing interest rates, enacting tighter lending standards or refusing to refinance existing debt upon its maturity or on terms similar to the expiring debt. Due to the above-listed factors, we cannot be certain that additional funding will be available if needed and, to the extent required, on acceptable terms.
Seasonal weather conditions and natural disasters could severely disrupt normal operations and harm our business.
Our water solutions operations are located across multiple regions of the U.S. Certain of these areas are adversely affected by seasonal weather conditions, primarily in the winter and spring. During periods of heavy snow, ice or rain, we may be unable to move our equipment between locations, thereby reducing our ability to provide services and generate revenues. Additionally, extended drought conditions in our operating regions could impact our ability to source sufficient water for our customers or increase the cost for such water. As a result, a natural disaster or inclement weather conditions could severely disrupt the normal operation of our business and adversely impact our financial condition and results of operations.
Disruptions in the transportation services of logistics companies transporting wastewater and other oilfield products could have an adverse effect on our results.
In areas where pipeline gathering systems have not yet been developed, we use trucks to transport produced water and other fluids to our wastewater disposal facilities. In recent years, certain states, such as North Dakota, Texas, Oklahoma, Louisiana and New Mexico and certain state counties have increased enforcement of weight limits on trucks used to transport raw materials on their public roads. It is possible that the states, counties and municipalities in which we operate our business may modify their laws or regulations to further reduce truck weight limits or impose curfews or other restrictions on the use of roadways. Such legislation and regulations and associated enforcement efforts could result in delays, and increased costs, with respect to the transport of produced water to our wastewater disposal facilities, which may either increase our operating costs or reduce the amount of produced water transported to our facilities. Such developments could decrease our operating margins or amounts of produced water and thereby have a material adverse effect on our results of operations and financial condition.
A significant increase in fuel prices may adversely affect our transportation costs, which could have a material adverse effect on our results of operations and financial condition.
Fuel is one of our significant operating expenses, and a significant increase in fuel prices could result in increased transportation costs. The price and supply of fuel is unpredictable and fluctuates based on events such as geopolitical developments, supply and demand for oil and gas, actions by oil and gas producers, war and unrest in oil producing countries and regions, regional production patterns and weather concerns. At times we have been able to pass along increases in fuel costs to customers, though we cannot guarantee our ability to do so in the future. Although the average price of fuel declined in 2024 and 2025 as a result of market oversupply, fuel prices constantly fluctuate and a significant increase in fuel prices could increase the price of, and therefore reduce demand for, our services, or force us to accept lower margins, both of which could affect our results of operations and financial condition.
Our industry typically experiences a high rate of employee turnover.
We are dependent upon the available labor pool of skilled employees and may not be able to find enough skilled labor to meet our needs, which could have a negative effect on our growth. We are also subject to the Fair Labor Standards Act, which governs such matters as minimum wage, overtime and other working conditions. Our operations require skilled workers who can perform physically demanding work. As a result of our industry volatility, as well as the demanding nature of the work, many workers have left the oilfield services section to pursue employment in different fields. If we are unable to retain or meet the growing demand for skilled technical personnel, our operating results and our ability to execute our growth strategies may be adversely affected.
40
Risks Related to Customers and Suppliers
Disruptions in production at our chemical manufacturing facilities may have a material adverse impact on our business, results of operations and/or financial condition.
Chemical manufacturing facilities in our industry are subject to outages and other disruptions. Serious disruptions at any of our facilities could impair our ability to use our facilities and have a material adverse impact on our revenue and increase our costs and expenses. Unplanned production disruptions may occur for external reasons including natural disasters, weather, disease, world health events, strikes, transportation interruption, government regulation, political or civil unrest or terrorism, or internal reasons, such as fire, unplanned maintenance or other manufacturing problems. Moreover, alternative facilities with sufficient capacity may not be available, may cost substantially more or may take a significant time to increase production or qualify with our customers, any of which could negatively impact our business, results of operations and/or financial condition. Long-term production disruptions may cause our customers to seek alternative supply, which could further adversely affect our profitability.
Additionally, we rely on a number of vendors, suppliers, and in some cases sole-source suppliers, service providers, toll manufacturers and collaborations with other industry participants to provide us with chemicals, feedstocks and other raw materials, along with energy sources and, in certain cases, facilities that we need to operate our business. If the business of these third parties is disrupted, some of these companies could be forced to reduce their output, shut down their operations or file for bankruptcy protection. If this were to occur, it could adversely affect their ability to provide us with the raw materials, energy sources or facilities that we need, which could materially disrupt our operations, including the production of certain of our chemical products. Moreover, it could be difficult to find replacements for certain of our business partners without incurring significant delays or cost increases. All of these risks could have a material adverse effect on our business, results of operations, financial condition and liquidity.
While we maintain business recovery plans that are intended to allow us to recover from natural disasters or other events that could disrupt our business, we cannot provide assurances that our plans would fully protect us from the effects of all such disasters or from events that might increase in frequency or intensity due to climate change. In addition, insurance may not adequately compensate us for any losses incurred as a result of natural or other disasters. In areas prone to frequent natural or other disasters, insurance may become increasingly expensive or not available at all.
Consolidation of our customers and competitors may impact our results of operations.
In recent years, the oil and gas industry has undergone rapid consolidation, which may result in reduced capital spending by some of our customers, the acquisition of one or more of our primary customers or competitors or consolidated entities using size and purchasing power to seek pricing or other concessions, which may lead to decreased demand for our products and services. In addition, recent, ongoing and future mergers, combinations and consolidations in our industry could result in existing competitors increasing their market share. As a result, industry consolidation may have a significant negative impact on our results of operations, financial position or cash flows. We are unable to predict what effect industry consolidations may have on the pricing of our products and services, capital spending by our customers, our selling strategies, our competitive position, our ability to retain customers or our ability to negotiate favorable agreements with our customer and suppliers.
Unsatisfactory safety performance may negatively affect our E&P customer relationships and, to the extent we fail to retain existing customers or attract new customers, adversely impact our revenues.
Our ability to retain existing E&P customers and attract new business is dependent on many factors, including our ability to demonstrate that we can reliably and safely operate our business and stay current on constantly changing rules, regulations, training and laws. Existing and potential customers consider the safety record of their service providers to be of high importance in their decision to engage third-party services. If one or more accidents were to occur at one of our operating sites, the affected customer may seek to terminate or cancel its use of our facilities or services and may be less likely to continue to use our services, which could cause us to lose substantial revenues. Further, our ability to attract new customers may be impaired if they elect not to purchase our third-party services because they view our safety record as unacceptable. In addition, it is possible that we will experience numerous or particularly severe accidents in the future, causing our safety record to deteriorate. This may be more likely as we
41
continue to grow, if we experience high employee turnover or labor shortage, or add inexperienced personnel. See Part I, Item 1. “Business – Environmental and Occupational Safety and Health Matters” for more discussion on worker safety matters.
Constraints in the supply of equipment used in providing services to our customers and replacement parts for such could affect our ability to execute our growth strategies.
Equipment used in providing services to our customers is normally readily available given our existing quantity of owned, leased and rented equipment. However, market conditions could trigger constraints in the supply chain of certain equipment or replacement parts for such equipment, which could have a material adverse effect on our business. The majority of our risk associated with supply chain constraints occurs in those situations where we have a relationship with a single supplier for a particular equipment set.
Significant price volatility or interruptions in supply of our raw materials for our chemicals business may result in increased costs that we may be unable to pass on to our customers, which could reduce profitability.
We purchase a substantial portion of our raw materials for our chemicals business from third-party suppliers and the cost of these raw materials represents a substantial portion of our operating expenses. The prices of the raw materials that we purchase from third parties are cyclical and volatile. Our supply agreements provide us only limited protection against price volatility because they are entered into either on a short-term basis or are longer-term volume contracts, which provide for market-based pricing renegotiated several times per year. While we attempt to match cost increases with corresponding product price increases, we are not always able to raise product prices immediately or at all. Timing differences between raw material prices, which may change daily, and contractual product prices, which in many cases are negotiated only monthly or less often, have had and may continue to have a negative effect on our cash flow. Any cost increase that we are not able to pass on to our customers could have a material adverse effect on our business, results of operations, financial condition and liquidity.
There are several raw materials for which there are only a limited number of suppliers or a single supplier. To mitigate potential supply constraints, we enter into supply agreements with particular suppliers, evaluate alternative sources of supply and evaluate alternative technologies to avoid reliance on limited or sole-source suppliers. Where supply relationships are concentrated, particular attention is paid by the parties to ensure strategic intentions are aligned to facilitate long-term planning. If certain of our suppliers are unable to meet their obligations under present supply agreements, we may be forced to pay higher prices to obtain the necessary raw materials from other sources and we may not be able to increase prices for our finished products to recoup the higher raw materials costs. Any interruption in the supply of raw materials could increase our costs or decrease our revenue, which could reduce our cash flow. The inability of a supplier to meet our raw material needs could have a material adverse effect on our financial condition and results of operations.
The number of sources for and availability of certain raw materials is also specific to the particular geographical region in which a facility is located. Political and economic instability in the countries from which we purchase our raw material supplies could adversely affect their availability. In addition, if raw materials become unavailable within a geographic area from which they are now sourced, we may not be able to obtain suitable or cost-effective substitutes. The importation of internationally sourced chemicals has, and may continue to, present new and additional challenges, such as increased freight costs, limited container space, and reduced production of certain chemicals. We may also experience higher operating costs, such as energy costs, which could affect our profitability. We may not always be able to increase our selling prices to offset the impact of any higher production costs or reduced production levels, which could reduce our earnings and decrease our liquidity.
42
Risks Related to Compliance with Regulations
Laws, regulations, executive actions and other regulatory initiatives in the U.S. relating to hydraulic fracturing could increase our costs of doing business and result in additional operating restrictions, delays or cancellations in the drilling and completion of oil and gas wells, or possible restrictions on the performance of hydraulic fracturing that may reduce demand for our services and could have a material adverse effect on our liquidity, results of operations and financial condition.
Although we do not directly engage in hydraulic fracturing, our operations support many of our E&P customers in such activities. The practice continues to be controversial in certain parts of the country, resulting in increased scrutiny and regulation of the hydraulic fracturing process, including by federal and state agencies and local municipalities. See Part I, Item 1. “Business – Environmental and Occupational Safety and Health Matters” for more discussion on these hydraulic fracturing and seismicity matters.
The adoption of any federal, state or local laws or the implementation of regulations or issuance of executive orders regarding hydraulic fracturing activities or leasing activities on federal properties could potentially cause a decrease in the completion of new oil and gas wells and an associated decrease in demand for our services and increased compliance costs and time, which could have a material adverse effect on our liquidity, results of operations, and financial condition.
Our and our E&P customers' operations are subject to a number of risks arising out of the threat of climate change, energy conservation measures or initiatives that stimulate demand for alternative forms of energy, which could result in increased operating and capital costs for our customers, restrictions on drilling for our customers and reduced demand for the products and services we provide.
The issue of climate change continues to attract considerable attention in the U.S. and foreign countries. As a result, numerous proposals have been made and may continue to be made at the international, national, regional and state levels of government to monitor and limit emissions of GHGs as well as to eliminate such future emissions. As a result, our operations as well as the operations of our E&P customers are subject to a series of regulatory, political, litigation and financial risks associated with the production and processing of fossil fuels and emission of GHGs. See Part I, Item 1. “Business – Environmental and Occupational Safety and Health Matters” for more discussion on the threat of climate and restriction of GHG emissions. The adoption and implementation of any international, federal, regional or state legislation, executive actions, regulations or other regulatory initiatives that impose more stringent standards for GHG emissions from the oil and natural gas sector or otherwise restrict the areas in which this sector may produce oil and natural gas or generate GHG emissions could result in increased compliance costs or costs of consuming fossil fuels. Such legislation, executive actions or regulations could result in increased costs of compliance or costs of consuming, and thereby reduce demand for oil and natural gas, which could reduce demand for our products and services. Additionally, political, financial and litigation risks may result in our customers restricting, delaying or canceling production activities, incurring liability for infrastructure damages as a result of climatic changes, or impairing the ability to continue to operate in an economic manner, which also could reduce demand for our products and services. The occurrence of one or more of these developments could have a material adverse effect on our business, financial condition, results of operations and cash flows. Moreover, the increased competitiveness of alternative energy sources (such as wind, solar geothermal, tidal and biofuels) could reduce demand for hydrocarbons, and therefore for our products and services, which would lead to a reduction in our revenues.
Our chemical products are subject to stringent chemical control laws that could result in increased costs on our business.
We are subject to a wide array of laws and regulations governing chemicals, including the regulation of chemical substances and inventories, such as the TSCA. These laws and regulations change frequently and have the potential to limit or ban altogether the types of chemicals we may use in our products, as well as result in increased costs related to testing, storing, and transporting our products prior to providing them to our customers. Any new restrictions on the development of new products or use of existing products, increases in regulation of those products, or disclosure of confidential, competitive information relating to the products could have an adverse effect on our operations and our
43
cost of doing business. Furthermore, governmental, regulatory and societal demands for increasing levels of product safety and environmental protection could result in increased pressure for more stringent regulatory control with respect to the chemical industry. See Part I, Item 1. “Business – Environmental and Occupational Safety and Health Matters” for more discussion on chemical product use and safety.
In the future, we may face increased obligations relating to the closing of our wastewater disposal facilities and may be required to provide an increased level of financial assurance to guarantee that the appropriate closure activities will occur for a wastewater disposal facility.
Our ability to obtain permits to own or operate wastewater disposal facilities generally requires us to establish performance bonds, letters of credit or other forms of financial assurance to address remediation and closure obligations. As we acquire additional wastewater disposal facilities or expand our existing wastewater disposal facilities, these obligations will increase. Additionally, in the future, regulatory agencies may require us to increase the amount of our closure bonds at existing wastewater disposal facilities. Moreover, actual costs could exceed our current expectations, as a result of, among other things, federal, state or local government regulatory action, increased costs charged by service providers that assist in closing wastewater disposal facilities and additional environmental remediation requirements. Increased regulatory requirements regarding our existing or future wastewater disposal facilities, including the requirement to pay increased closure and post-closure costs or to establish increased financial assurance for such activities could substantially increase our operating costs and adversely affect our business, financial condition and results of operations.
State and federal legislation and regulatory initiatives relating to our disposal operations and seismicity could harm our business.
Our disposal business and the number of SWDs we operate has significantly increased since 2021. This disposal process has been linked to increased induced seismicity events in certain areas of the country, particularly in certain counties in Oklahoma, Texas, Colorado, and New Mexico. For example, Texas and Oklahoma have issued rules for wastewater disposal wells that impose certain permitting and operating restrictions and reporting requirements on disposal wells in proximity to faults. States have also issued orders, from time to time, for certain wells where seismic incidents have occurred to restrict or suspend disposal well operations. Another consequence of seismic events may be lawsuits alleging that disposal well operations have caused damage to neighboring properties or otherwise violated state and federal rules regulating waste disposal. These and other states have begun to consider or adopt laws and regulations that may restrict or otherwise prohibit oilfield fluid disposal in certain areas or underground disposal wells, and state agencies implementing these requirements may issue orders directing certain wells where seismic incidents have occurred to restrict or suspend disposal well operations or impose standards related to disposal well construction and monitoring. For example, in December 2023 the Texas Railroad Commission suspended the permits of 23 deep disposal wells in a seismic response area in Culberson and Reeves Counties. Any one or more of these developments may result in our having to limit disposal well volumes, disposal rates or locations, or to cease disposal well activities, which could have a material adverse effect on our business, financial condition, and results of operations. See Part I, Item 1. “Business – Environmental and Occupational Safety and Health Matters” for more discussion on seismic matters.
Changes in U.S. and international trade policies, such as the imposition of tariffs, particularly involving China, may adversely impact our business and operating results.
Though a comprehensive trade agreement was signed in 2020, the U.S. government has previously imposed tariffs affecting certain goods produced in China and the Trump administration has stated an intention to impose tariffs on international goods, including those produced in China. Approximately 8% of the raw material feedstock for our chemicals we produced in 2025 originated in China and were sold to us by our supplier partners. As a result, tariffs incurred by our supplier partners could increase our costs and reduce profitability. Additionally, delays or interruptions in the supply of some chemicals for any reason could impact our ability to generate chemicals revenue. If we are forced to source chemicals currently originating in China from other countries, such compounds might be more expensive, inferior in quality, or take longer to source. If we incur higher costs that we cannot pass on to our customers or if we are unable to adequately replace the chemicals we currently source with chemicals produced elsewhere, our business could be adversely affected.
44
In addition, to the extent that any U.S. trade policy results in retaliatory tariffs against the U.S., such as the recently announced tariffs from China on U.S. natural gas and crude oil, such developments could have an adverse effect on our customers’ business, and reduce demand for our services, which could have a material adverse effect on our business, results of operations and financial condition.
Changes to applicable tax laws and regulations or exposure to additional tax liabilities could adversely affect our operating results and cash flows.
We are subject to various complex and evolving U.S. federal, state and local tax laws. U.S. federal, state and local tax laws, policies, statutes, rules, regulations or ordinances could be interpreted, changed, modified or applied adversely to us, in each case, possibly with retroactive effect. Any change or modification of current tax laws, any significant variance in our interpretation of current tax laws or a successful challenge of one or more of our tax positions by the U.S. Internal Revenue Service or other tax authorities could increase our future tax liabilities and adversely affect our operating results and cash flows.
We are subject to environmental and occupational health and safety laws and regulations that may expose us to significant liabilities for penalties, damages or costs of remediation or compliance.
Our operations and the operations of our E&P customers are subject to federal, state and local laws and regulations in the U.S. relating to protection of natural resources and the environment, health and safety aspects of our operations and waste management, including the transportation and disposal of waste and other materials. These laws and regulations may take the form of laws, regulations, executive actions and various other legal initiatives and result in the imposition of numerous obligations on our operations and the operations of our customers and liability for administrative, civil and criminal fines and penalties. See Part I, Item 1. “Business – Environmental and Occupational Safety and Health Matters” for more discussion on these matters. Compliance with these regulations and other regulatory initiatives, or any other new environmental laws, regulations and executive actions could, among other things, require us or our customers to install new or modified emission controls on equipment or processes, incur longer permitting timelines, and incur significantly increased capital or operating expenditures, which costs may be significant. One or more of these developments that impact our customers could reduce demand for our services, which could have a material adverse effect on our business, results of operations and financial condition.
The Endangered Species Act and Migratory Bird Treaty Act govern both our and our E&P customers’ operations and additional restrictions may be imposed in the future, which constraints could have an adverse impact on our ability to expand some of our existing operations or limit our customers’ ability to develop new oil and gas wells.
The ESA and comparable state laws restrict activities that may affect endangered or threatened species or their habitats. Similar protections are afforded to migratory birds under the MBTA. To the degree that species listed under the ESA or similar state laws, or are protected under the MBTA, live in the areas where we or our E&P customers’ operate, both our and our customers’ abilities to conduct or expand operations and construct facilities could be limited or be forced to incur additional material costs. Additionally, the FWS may make determinations on the listing of unlisted species as endangered or threatened under the ESA. See Part I, Item 1. “Business – Environmental and Occupational Safety and Health Matters” for more discussion on ESA and MBTA matters. The designation of previously unidentified endangered or threatened species could indirectly cause us to incur additional costs, cause our or our E&P customers’ operations to become subject to operating restrictions or bans and limit future development activity in affected areas, which developments could have a material adverse effect on our business, results of operations and financial condition.
Increasing attention to sustainability and environmental matters may impact our business.
Companies across all industries are facing increasing scrutiny from investors, customers, employees, regulatory bodies and other stakeholders related to their sustainability and environmental practices. Companies which do not adapt to or comply with such stakeholder expectations and standards, which are evolving, or which are perceived to have not responded appropriately to the growing concern for sustainability- and environmental-related issues, regardless of whether there is a legal requirement to do so, may suffer from reputational damage and the business, financial condition, and/or stock price of such a company could be materially and adversely affected. Increasing attention to climate change, increasing societal expectations on companies to address climate change, and potential consumer use of substitutes to
45
energy commodities may result in increased costs, reduced demand for our customers’ hydrocarbon products and our products and services, reduced profits, increased investigations and litigation, and negative impacts on our stock price and access to capital markets, or ability to attract and retain a talented workforce. Increasing attention to climate change, for example, may result in demand shifts for our customers’ hydrocarbon products and additional governmental investigations and private litigation against those customers.
Also, despite any aspirational goals, we may receive pressure from investors, lenders or other groups to adopt more aggressive climate-, sustainability- or other environmental-related goals, but we cannot guarantee that we will be able to implement such goals because of changes in activity levels, potential costs or technical or operational obstacles. Certain statements or initiatives with respect to sustainability and environmental matters that we may pursue or assert are increasingly subject to heightened scrutiny from the public and governmental authorities, as well as other parties. Regulators, such as the SEC and various state agencies, as well as non-governmental organizations and other private actors have filed lawsuits under various securities and consumer protection laws alleging that certain sustainability or environmental statements, goals or standards were misleading, false or otherwise deceptive. Certain employment practices and social initiatives are the subject of scrutiny by both those calling for the continued advancement of such policies, as well as those who believe they should be curbed, including government actors, and the complex regulatory and legal frameworks applicable to such initiatives continue to evolve. More recent political developments could result in increased criticism or litigation risks from certain “anti-ESG” parties, including various governmental agencies. Such sentiment may focus on our environmental or social commitments (such as reducing GHG emissions) or our potential pursuit of certain employment practices or social initiatives that are alleged to be political or polarizing in nature or are alleged to violate laws based, in part, on changing priorities of, or interpretations by, federal agencies or state governments. Consideration of sustainability- or environmental-related factors in our decision-making could be subject to increasing scrutiny and objection from such parties. As a result, we may be subject to pressure in the media or through other means, such as governmental investigations, enforcement actions, or other proceedings, all of which could adversely affect our reputation, business, financial performance, market access and growth. Accordingly, there may be increased costs related to reviewing, implementing and managing such policies, as well as compliance and litigation risks based both on positions we do or do not take, or work we do or do not perform.
Risks Related to Our Capital Structure
We may not be able to continue to pay or maintain our cash dividends and the failure to do so may negatively affect our share price.
Since the fourth quarter of 2022, we have paid a quarterly cash dividend on our shares of Class A common stock and SES Holdings, LLC Units (along with Class B Shares). Most recently, in January 2026, we announced a quarterly cash dividend of $0.07 per share. Our ability to pay cash dividends depends on, among other things, our cash flows from operations, our cash requirements, our financial condition, the degree to which we are/or become leveraged, contractual restrictions binding on us, provisions of applicable law and other factors that our board of directors may deem relevant. There can be no assurance that we will generate sufficient cash from continuing operations in the future or have sufficient cash surplus or net profits to pay dividends on our Class A common stock. Our dividend policy is based upon our directors’ current assessment of our business and the environment in which we operate, and that assessment could change based on business development opportunities (which could, for example, increase our need for capital expenditures) or new growth opportunities. All future dividend payments are subject to quarterly review and approval by our board of directors. Our board of directors may, in its discretion, decrease the level of cash dividends or entirely discontinue the payment of cash dividends. A reduction or elimination of cash dividends could negatively affect the market price of our Class A common stock.
If we fail to maintain and enhance an effective system of internal controls, we may not be able to accurately report our financial results or prevent fraud. As a result, current and potential stockholders could lose confidence in our financial reporting, which would harm our business and the trading price of our Class A common stock.
Effective internal controls are necessary for us to provide reliable financial reports, prevent fraud and operate successfully as a public company. We are subject to Section 404 of the Sarbanes-Oxley Act of 2002 (“Sarbanes-Oxley”) and therefore are required to make a formal assessment of the effectiveness of our internal controls over financial
46
reporting for that purpose. We cannot be certain that our efforts to maintain and enhance our internal controls will be successful, that we will be able to maintain adequate controls over our financial processes and reporting in the future or that we will be able to comply with our obligations under Sections 302 and 404 of Sarbanes-Oxley. Any failure to maintain effective internal controls, or difficulties encountered in implementing or improving our internal controls, could harm our operating results or cause us to fail to meet our reporting obligations. Ineffective internal controls could also cause investors to lose confidence in our reported financial information, which would likely have a negative effect on the trading price of our Class A common stock.
We may incur indebtedness or issue additional equity securities to execute our long-term growth strategy, which may reduce our profitability or result in significant dilution to our stockholders.
Constructing and maintaining water infrastructure used in the oil and gas industry requires significant capital. We may require additional capital in the future to develop and construct water sourcing, transfer, recycling and other related infrastructure to execute our growth strategy. For the years ended December 31, 2025, 2024 and 2023, we spent $294.6 million, $173.2 million and $135.9 million, respectively, in capital expenditures (excluding expenditures connected with business combinations). Historically, we have financed these investments through cash flows from operations, external borrowings, capital contributions and proceeds from the issuance of equity securities. These sources of capital may not be available to us in the future. If we are unable to fund capital expenditures for any reason, we may not be able to capture available growth opportunities or effectively maintain our existing assets and any such failure could have a material adverse effect on our results of operations and financial condition. If we incur additional indebtedness or issue additional equity securities, our profitability may be reduced and our stockholders may experience significant dilution.
Our Sustainability-Linked Credit Facility subjects us to various financial and other restrictive covenants. These restrictions may limit our operational or financial flexibility and could subject us to potential defaults under our Sustainability-Linked Credit Facility.
Our Sustainability-Linked Credit Facility subjects us to significant financial and other restrictive covenants, including restrictions on our ability to consolidate or merge with other companies, conduct asset sales, incur additional indebtedness, grant liens, issue guarantees, make investments, loans or advances, pay dividends and enter into certain transactions with affiliates.
For additional information regarding our Sustainability-Linked Credit Facility, please read Part II, Item 7. “Management’s Discussion and Analysis of Financial Condition and Results of Operations – Liquidity and Capital Resources – Sustainability-Linked Credit Facility.”
If we are unable to remain in compliance with the covenants of our Sustainability-Linked Credit Facility, with such non-compliance resulting in an event of default, then the lenders may declare all amounts outstanding under the Sustainability-Linked Credit Facility to be immediately due and payable and exercise other rights and remedies thereunder. Any such acceleration or exercise of rights or remedies thereunder could have a material adverse effect on our financial condition and results of operations.
Future sales of our equity securities, or the perception that such sales may occur, may depress our share price, and any additional capital raised through the sale of equity or convertible securities may dilute your ownership in us.
Subject to certain limitations and exceptions, Crestview and its permitted transferees may exchange their SES Holdings LLC Units (together with a corresponding number of shares of Class B common stock) for shares of Class A common stock (on a one-for-one basis, subject to conversion rate adjustments for stock splits, stock dividends and reclassification and other similar transactions) and then sell those shares of Class A common stock. Additionally, we may in the future issue our previously authorized and unissued securities. We are authorized to issue 350 million shares of Class A common stock, 150 million shares of Class B common stock and 50 million shares of preferred stock with such designations, preferences and rights as determined by our board of directors. The potential issuance of such additional shares of equity securities will result in the dilution of the ownership interests of the holders of our Class A common stock and may create downward pressure on the trading price, if any, of our Class A common stock.
47
In addition, Legacy Owner Holdco, Crestview Partners II SES Investment B, LLC (collectively, the “Registration Rights Holders”), who collectively own approximately 20 million shares of our common stock, are party to a registration rights agreement that provides, among other things, for parties to that agreement to initiate or participate in an underwritten public offering of all or a portion of their shares. The Registration Rights Holders may exercise their rights under such agreement in their sole discretion, and sales pursuant to such rights may be material in amount and occur at any time. The sales of substantial amounts of our Class A common stock or the perception that these sales may occur, could cause the market price of our Class A common stock to decline and impair our ability to raise capital. We also may grant additional registration rights in connection with any future issuance of our capital stock.
We cannot predict the size of future issuances of our Class A common stock or securities convertible into Class A common stock or the effect, if any, that future issuances and sales of shares of our Class A common stock will have on the market price of our Class A common stock. Sales of substantial amounts of our Class A common stock (including shares issued in connection with an acquisition), or the perception that such sales could occur, may adversely affect prevailing market prices of our Class A common stock.
Provisions in our amended and restated certificate of incorporation and amended and restated bylaws and Delaware law may discourage a takeover attempt even if a takeover might be beneficial to our stockholders.
Provisions contained in our Fifth Amended and Restated Certificate of Incorporation and our Third Amended and Restated Bylaws, which we refer to herein as our “amended and restated certificate of incorporation” and “amended and restated bylaws,” respectively, could make it more difficult for a third party to acquire us. Provisions of our amended and restated certificate of incorporation and amended and restated bylaws impose various procedural and other requirements, which could make it more difficult for stockholders to effect certain corporate actions. For example, our amended and restated certificate of incorporation authorizes our board of directors to determine the rights, preferences, privileges and restrictions of unissued series of preferred stock without any vote or action by our stockholders. Thus, our board of directors can authorize and issue shares of preferred stock with voting or conversion rights that could adversely affect the voting or other rights of holders of our capital stock. These rights may have the effect of delaying or deterring a change of control of our company. Additionally, our amended and restated bylaws establish limitations on the removal of directors and on the ability of our stockholders to call special meetings and include advance notice requirements for nominations for election to our board of directors and for proposing matters that can be acted upon at stockholder meetings. These provisions could limit the price that certain investors might be willing to pay in the future for shares of our Class A common stock.
In addition, certain change of control events have the effect of accelerating the payment due under our TRAs (as defined herein), which could be substantial and accordingly serve as a disincentive to a potential acquirer of our company. See “—Risks Related to Our Organizational Structure—In certain cases, payments under the TRAs may be accelerated and/or significantly exceed the actual benefits, if any, we realize in respect of the tax attributes subject to the TRAs.”
Our amended and restated certificate of incorporation contains a provision renouncing our interest and expectancy in certain corporate opportunities, which could adversely affect our business or prospects.
Our amended and restated certificate of incorporation provides that, to the fullest extent permitted by applicable law, we renounce any interest or expectancy in any business opportunity that involves any aspect of the energy business or industry and that may be from time to time presented to any member of (i) Legacy Owner Holdco; Crestview Partners II SES Investment, LLC; any funds, limited partnerships or other investment entities or vehicles managed by Crestview Partners or controlled by Crestview GP; B-29 Investments, LP; Sunray Capital, LP; Proactive Investments, LP and their respective affiliates, other than us (collectively, the “SES Group”); (ii) the other entities (existing and future) that participate in the energy industry and in which the SES Group owns substantial equity interests (the “Portfolio Companies”) or (iii) any director or officer of the corporation who is also an employee, partner, member, manager, officer or director of any member of the SES Group or the Portfolio Companies, including our Chairman, President and Chief Executive Officer (“CEO”), John D. Schmitz, and our Executive Vice President, Business and Regulatory Affairs, Cody Ortowski, even if the opportunity is one that we might reasonably have pursued or had the ability or desire to pursue if granted the opportunity to do so. Mr. Schmitz controls both B-29 Investments, LP and Sunray Capital, LP and
48
is a direct and indirect beneficiary of these provisions in our amended and restated certificate of incorporation. Our amended and restated certificate of incorporation further provides that no such person or party shall be liable to us by reason of the fact that such person pursues any such business opportunity or fails to offer any such business opportunity to us.
As a result, any member of the SES Group or the Portfolio Companies or any director or officer of the corporation who is also an employee, partner, member, manager, officer or director of any member of the SES Group or the Portfolio Companies may become aware, from time to time, of certain business opportunities, such as acquisition opportunities, and may direct such opportunities to other businesses in which they have invested, in which case we may not become aware of or otherwise have the ability to pursue such opportunity. Further, such businesses may choose to compete with us for these opportunities. As a result, by renouncing our interest and expectancy in any business opportunity that may be from time to time presented to any member of the SES Group or the Portfolio Companies or any director or officer of the corporation who is also an employee, partner, member, manager, officer or director of any member of the SES Group or the Portfolio Companies, our business or prospects could be adversely affected if attractive business opportunities are procured by such parties for their own benefit rather than for ours. See Part III, Item 13. “Certain Relationships and Related Transactions, and Director Independence.”
We may issue preferred stock whose terms could adversely affect the voting power or value of our Class A common stock.
Our amended and restated certificate of incorporation authorizes us to issue, without the approval of our stockholders, one or more classes or series of preferred stock having such designations, preferences, limitations and relative rights, including preferences over our Class A common stock respecting dividends and distributions, as our board of directors may determine. The terms of one or more classes or series of preferred stock could adversely impact the voting power or value of our Class A common stock. For example, we might grant holders of preferred stock the right to elect some number of our directors in all events or on the happening of specified events or the right to veto specified transactions. Similarly, the repurchase or redemption rights or liquidation preferences we might assign to holders of preferred stock could affect the residual value of the Class A common stock.
Our amended and restated certificate of incorporation designates the Court of Chancery of the State of Delaware as the sole and exclusive forum for certain types of actions and proceedings that may be initiated by our stockholders, which could limit our stockholders’ ability to obtain a favorable judicial forum for disputes with us or our directors, officers, employees or agents.
Our amended and restated certificate of incorporation provides that, unless we consent in writing to the selection of an alternative forum, the Court of Chancery of the State of Delaware will, to the fullest extent permitted by applicable law, be the sole and exclusive forum for (i) any derivative action or proceeding brought on our behalf, (ii) any action asserting a claim of breach of a fiduciary duty owed by any of our directors, officers, employees or agents to us or our stockholders, (iii) any action asserting a claim against us or any director or officer or other employee or agent of ours arising pursuant to any provision of the Delaware General Corporation Law, our amended and restated certificate of incorporation or our amended and restated bylaws, or (iv) any action asserting a claim against us or any director or officer or other employee or agent of ours that is governed by the internal affairs doctrine, in each such case subject to such Court of Chancery having personal jurisdiction over the indispensable parties named as defendants therein.
The exclusive forum provision would not apply to suits brought to enforce any liability or duty created by the Securities Act or the Exchange Act or any other claim for which the federal courts have exclusive jurisdiction. To the extent that any such claims may be based upon federal law claims, Section 27 of the Exchange Act creates exclusive federal jurisdiction over all suits brought to enforce any duty or liability created by the Exchange Act or the rules and regulations thereunder. Furthermore, Section 22 of the Securities Act creates concurrent jurisdiction for federal and state courts over all suits brought to enforce any duty or liability created by the Securities Act or the rules and regulations thereunder.
The enforceability of similar choice of forum provisions in other companies’ certificates of incorporation or similar governing documents has been challenged in legal proceedings, and it is possible that a court could find the
49
choice of forum provisions contained in our amended and restated certificate of incorporation to be inapplicable or unenforceable, including with respect to claims arising under the U.S. federal securities laws.
To the fullest extent permitted by law, any person or entity purchasing or otherwise acquiring any interest in shares of our capital stock will be deemed to have notice of, and consented to, the provisions of our amended and restated certificate of incorporation described in the preceding sentence. This choice of forum provision may limit a stockholder’s ability to bring a claim in a judicial forum that it finds favorable for disputes with us or our directors, officers, employees or agents, which may discourage such lawsuits against us and such persons. Alternatively, if a court were to find these provisions of our amended and restated certificate of incorporation inapplicable to, or unenforceable in respect of, one or more of the specified types of actions or proceedings, we may incur additional costs associated with resolving such matters in other jurisdictions, which could adversely affect our business, financial condition or results of operations.
Risks Related to Our Organizational Structure
We are a holding company. Our sole material asset consists of SES Holdings LLC Units, and accordingly, we are dependent upon distributions and payments from SES Holdings to pay taxes, pay dividends, make payments under the Tax Receivable Agreements and cover our corporate and other overhead expenses.
We are a holding company and have no material assets other than our equity interest in SES Holdings. We have no independent means of generating revenue. To the extent SES Holdings has available cash, we intend to cause SES Holdings to make (i) generally pro rata distributions to its unitholders, including us, in an amount at least sufficient to allow us to pay our taxes, pay dividends and to make payments under the TRAs that we entered into in connection with our restructuring at the Select 144A Offering and any subsequent TRAs that we may enter into in connection with future acquisitions and (ii) non-pro rata payments to us to reimburse us for our corporate and other overhead expenses. We will be limited, however, in our ability to cause SES Holdings and its subsidiaries to make these and other distributions or payments to us due to certain limitations, including the restrictions under our Sustainability-Linked Credit Facility and the cash requirements and financial condition of SES Holdings. To the extent that we need funds and SES Holdings or its subsidiaries are restricted from making such distributions or payments under applicable law or regulations or under the terms of their financing arrangements or are otherwise unable to provide such funds, our liquidity and financial condition could be adversely affected.
We will be required to make payments under the Tax Receivable Agreements for certain tax benefits we may claim, and the amounts of such payments could be significant.
In connection with our restructuring at the Select 144A Offering, we entered into the TRAs with certain affiliates of the then-holders of SES Holdings LLC Units (each such person and any permitted transferee thereof, a “TRA Holder,” and together, the “TRA Holders”) which generally provide for the payment by us to the TRA Holders of 85% of the net cash savings, if any, in U.S. federal, state and local income and franchise tax that we actually realize (computed using simplifying assumptions to address the impact of state and local taxes) or are deemed to realize in certain circumstances as a result of certain tax basis increases, net operating losses available to us as a result of certain reorganization transactions entered into in connection with the Select 144A Offering, and certain tax benefits attributable to imputed interest. We will retain the benefit of the remaining 15% of these cash savings.
The term of each TRA commenced upon the completion of the Select 144A Offering and will continue until all tax benefits that are subject to such TRAs have been utilized or expired, unless we exercise our right to terminate the TRAs (or the TRAs are terminated due to other circumstances, including our breach of a material obligation thereunder or certain mergers or other changes of control) and we make the termination payment specified in the TRAs. In addition, payments we make under the TRAs will be increased by any interest accrued from the due date (without extensions) of the corresponding tax return. We commenced payments under the TRAs in 2024. In the event that the TRAs are not terminated and we have sufficient taxable income to utilize all of the tax benefits subject to the TRAs, the payments due under the TRA entered into with Legacy Owner Holdco and Crestview GP continue until the benefits of the last exchange of SES Holdings LLC Units are realized or expire, and the payments due under the TRA entered into with an affiliate of Legacy Owner Holdco and Crestview GP continue until the benefits of the exchanges are realized or expire.
50
The payment obligations under the TRAs are our obligations and not obligations of SES Holdings, and we expect that the payments we will be required to make under the TRAs will be substantial. Estimating the amount and timing of payments that may become due under the TRAs is by its nature imprecise. For purposes of the TRAs, cash savings in tax generally will be calculated by comparing our actual tax liability (using the actual applicable U.S. federal income tax rate and an assumed combined state and local income and franchise tax rate) to the amount we would have been required to pay had we not been able to utilize any of the tax benefits subject to the TRAs. The amounts payable, as well as the timing of any payments, under the TRAs are dependent upon future events and significant assumptions, including the timing of the exchanges of SES Holdings LLC Units, the market price of our Class A common stock at the time of each exchange (since such market price will determine the amount of tax basis increases resulting from the exchange), the extent to which such exchanges are taxable transactions, the amount of the exchanging unitholder’s tax basis in its SES Holdings LLC Units at the time of the relevant exchange, the depreciation and amortization periods that apply to the increase in tax basis, the amount of net operating losses available to us as a result of reorganization transactions entered into in connection with the Select 144A Offering, the amount and timing of taxable income we generate in the future, the U.S. federal income tax rate then applicable, and the portion of our payments under the TRAs that constitute imputed interest or give rise to depreciable or amortizable tax basis.
Certain of the TRA Holders’ rights under the TRAs are transferable in connection with a permitted transfer of SES Holdings LLC Units or if the TRA Holder no longer holds SES Holdings LLC Units. The payments under the TRAs are not conditioned upon the continued ownership interest in either SES Holdings or us of any holder of rights under the TRAs. See Part III, Item 13. “Certain Relationships and Related Transactions, and Director Independence.”
In certain cases, payments under the Tax Receivable Agreements may be accelerated and/or significantly exceed the actual benefits, if any, we realize in respect of the tax attributes subject to the Tax Receivable Agreements.
If we elect to terminate the TRAs early or they are terminated early due to our failure to honor a material obligation thereunder or due to certain mergers, asset sales, other forms of business combinations or other changes of control, our obligations under the TRAs would accelerate and we would be required to make an immediate payment equal to the present value of the anticipated future payments to be made by us under the TRAs (determined by applying a discount rate of the lesser of 6.50% per annum, compounded annually, or the 12-month term secured overnight financing rate (“SOFR”) published by CME Group Benchmark Administration plus 171.513 basis points); and such payment is expected to be substantial. The discount rate used as of December 31, 2025 was 5.49%. The calculation of anticipated future payments will be based upon certain assumptions and deemed events set forth in the TRAs, including (i) the assumption that we have sufficient taxable income to fully utilize the tax benefits covered by the TRAs, (ii) the assumption that any SES Holdings LLC Units (other than those held by us) outstanding on the termination date are exchanged on the termination date and (iii) certain loss or credit carryovers will be utilized in the taxable year that includes the termination date. Any early termination payment may be made significantly in advance of the actual realization, if any, of the future tax benefits to which the termination payment relates.
As a result of either an early termination or a “change of control” (as defined in the TRAs as amended), we could be required to make payments under the TRAs that exceed our actual cash tax savings under the TRAs. In these situations, our obligations under the TRAs could have a substantial negative impact on our liquidity and could have the effect of delaying, deferring or preventing certain mergers, asset sales or other forms of business combinations or changes of control. For example, if the TRAs were terminated on December 31, 2025, the estimated termination payments would have been approximately $79.1 million (calculated using a 5.49% discount rate, applied against an undiscounted liability of approximately $107.3 million, based upon the last reported closing sale price of our Class A common stock on December 31, 2025) in the aggregate. The foregoing number is merely an estimate and the actual payment could differ materially. There can be no assurance that we will be able to finance our obligations under the TRAs.
Payments under the TRAs will be based on the tax reporting positions that we will determine. The TRA Holders will not reimburse us for any payments previously made under the TRAs if any tax benefits that have given rise to payments under the TRAs are subsequently disallowed, except that excess payments made to the TRA Holders will be netted against payments that would otherwise be made to the TRA Holders, if any, after our determination of such excess. As a result, in such circumstances, we could make payments that are greater than our actual cash tax savings, if
51
any, and may not be able to recoup those payments, which could adversely affect our liquidity. See Part III, Item 13. “Certain Relationships and Related Transactions, and Director Independence.”
If SES Holdings were to become a publicly-traded partnership taxable as a corporation for U.S. federal income tax purposes, we and SES Holdings might be subject to potentially significant tax inefficiencies, and we would not be able to recover payments previously made by us under the Tax Receivable Agreements even if the corresponding tax benefits were subsequently determined to have been unavailable due to such status.
We intend to operate such that SES Holdings does not become a publicly-traded partnership taxable as a corporation for U.S. federal income tax purposes. A “publicly-traded partnership” is a partnership, the interests of which are traded on an established securities market or are readily tradeable on a secondary market or the substantial equivalent thereof. Under certain circumstances, exchanges of SES Holdings LLC Units for shares of our Class A common stock or cash pursuant to the SES Holdings LLC Agreement or other transfers of SES Holdings LLC Units could cause SES Holdings to be treated as a publicly-traded partnership. Applicable U.S. Treasury regulations provide for certain safe harbors from treatment as a publicly-traded partnership, and we intend to operate such that exchanges or other transfers of SES Holdings LLC Units qualify for one or more such safe harbors. For example, we intend to limit the number of unitholders of SES Holdings and Legacy Owner Holdco, and the SES Holdings LLC Agreement provides for limitations on the ability of unitholders of SES Holdings to transfer their SES Holdings LLC Units and will provide us, as managing member of SES Holdings, with the right to impose restrictions (in addition to those already in place) on the ability of unitholders of SES Holdings to exchange their SES Holdings LLC Units pursuant to the SES Holdings LLC Agreement to the extent we believe it is necessary to ensure that SES Holdings will continue to be treated as a partnership for U.S. federal income tax purposes. If SES Holdings were to become a publicly-traded partnership, significant tax inefficiencies might result for us and for SES Holdings. In addition, we may not be able to realize tax benefits covered under the TRAs, and we would not be able to recover any payments previously made by us under the TRAs, even if the corresponding tax benefits (including any claimed increase in the tax basis of SES Holdings’ assets) were subsequently determined to have been unavailable.
Our ability to use certain of our current and future NOL carryforwards may be limited and could adversely affect our operating results and cash flows.
As of December 31, 2025, the Company and certain of its corporate subsidiaries had approximately $210.6 million of tax-affected U.S. federal NOLs, $87.7 million of which we expect to expire unused beginning in 2031 due to limitations under Section 382 of the Internal Revenue Code of 1986, as amended (the “Code”). As of December 31, 2025, the Company and certain of its corporate subsidiaries also had approximately $19.2 million of tax-affected state NOLs, $6.6 million of which we expect to expire unused and the remaining $12.6 million of which we expect to expire beginning in 2026, and tax-affected non-U.S. NOLs of approximately $1.4 million, which we expect to expire beginning in 2035. Utilization of these NOLs (which include historic NOLs of Rockwater Energy Solutions Inc. (“Rockwater”), Nuverra Environmental Solutions Inc. (“Nuverra”), and Buckhorn Disposal ND, Inc. (“Buckhorn”)) depends on many factors, including our future income, which cannot be assured. In addition, Section 382 of the Code generally imposes an annual limitation on the amount of NOLs that may be used to offset taxable income when a corporation has undergone an “ownership change” (as determined under Section 382 of the Code). An ownership change generally occurs if one or more stockholders (or groups of stockholders) who are each deemed to own at least 5% of the relevant corporation’s stock change their ownership by more than 50 percentage points over their lowest ownership percentage within a rolling three-year period. In the event that an ownership change has occurred, or were to occur, utilization of the relevant corporation’s NOLs would be subject to an annual limitation under Section 382 of the Code, determined by multiplying the value of the relevant corporation’s stock at the time of the ownership change by the applicable long-term tax-exempt rate as defined in Section 382 of the Code, and potentially increased for certain gains recognized within five years after the ownership change to the extent of certain net built-in gains at the time of the ownership change. Any unused annual limitation may be carried over to later years until they expire. Limitations similar to those applicable under Section 382 of the Code apply for U.S. state and non-U.S. income tax purposes.
While we do not believe that the acquisitions of Rockwater, Nuverra or Buckhorn resulted in an ownership change under Section 382 of the Code with respect to us, future issuances, sales and/or exchanges of our stock (including in connection with an exercise of the Exchange Right (as described in Note 1 to the consolidated financial statements) or
52
other transactions beyond our control), taken together with prior transactions with respect to our stock, could cause us to undergo an ownership change. As a result, we cannot assure you that we will not undergo an ownership change in the future. We believe that the acquisitions of Rockwater, Nuverra and Buckhorn resulted in ownership changes with respect to each of Rockwater, Nuverra and Buckhorn, respectively. Accordingly, as described above, some or all of our U.S. federal or state or non-U.S. NOLs could expire before they can be used. In addition, future ownership changes or changes to the U.S. tax laws could limit our ability to utilize our NOLs. To the extent we are not able to offset our future income with our NOLs, this would adversely affect our operating results and cash flows.
Our investment in AV Farms could be materially and adversely affected by our lack of sole decision-making authority, our reliance on our co-investors’ financial condition, and disputes between our co-investors and us.
As described in Note 2—Significant Accounting Policies, we recently entered into a new arrangement with C&A Rollover Company, LLC (“C&A”) and Geneses pursuant to which we have jointly invested in AV Farms and AV GP. AV Farms was formed to consolidate and commercialize one of the largest water holdings and storage portfolios in Colorado. Currently, we, C&A and Geneses own approximately 39%, 38% and 23%, respectively, of AV Farms and 25%, 50% and 25%, respectively, of AV GP. We have contributed $72 million in capital to AV Farms during the first quarter of 2025 and expect to contribute approximately $74 million in additional contributions over a three-year period. As such, we may not have a controlling interest in AV Farms and may share responsibility with C&A and Geneses for managing the operations of AV Farms as we may not have sole decision-making authority regarding AV Farms, which presents risks that may not be present in our other operations. For example, C&A or Geneses may have economic or other business interests or goals which are inconsistent with our business interests or goals, and may be in a position to take actions contrary to our preferences, policies or objectives. Additionally, it is possible that C&A or Geneses might become bankrupt, fail to fund their share of capital contributions or block or delay decisions that we believe are necessary. Such an investment may also have the potential risk of impasses on decisions, such as sales, because neither we nor C&A and Geneses may have full control over AV Farms. Disputes between us and C&A or Geneses may result in litigation or arbitration that would increase our expenses and divert the attention of our officers and directors from other aspects of our business. We may in certain circumstances be liable for the actions of such third parties. Any of the foregoing factors could materially and adversely affect our AV Farms investment.
General Risks
We may not be able to finance future growth of our operations or future acquisitions, which could adversely affect our operations and financial position.
The successful execution of our growth strategy depends on our ability to generate sufficient cash flows and our access to capital, both of which are impacted by numerous factors beyond our control, including financial, business, economic and other factors, such as volatility in commodity prices, inflationary pressures and associated monetary policy and pressure from competitors. There have been recent increases in the cost of capital and interest rates, which may affect future borrowings and impact the financial benefit we may receive. If we are unable to generate sufficient cash flows or obtain additional capital on favorable terms or at all, we may be unable to continue growing our business, conduct necessary corporate activities, take advantage of business opportunities that arise or engage in activities that may be in our long-term best interest, which may adversely impact our ability to sustain or improve our current level of profitability.
The growth of our business through acquisitions may expose us to various risks, including those relating to difficulties in identifying suitable, accretive acquisition opportunities and integrating businesses, assets and personnel, as well as difficulties in obtaining financing for targeted acquisitions and the potential for increased leverage or debt service requirements.
As a component of our business strategy, we intend to pursue selected, accretive acquisitions of complementary assets, businesses and technologies. Acquisitions involve numerous risks, including: unanticipated costs and assumption of liabilities and exposure to unforeseen liabilities of the acquired business, including but not limited to environmental liabilities and plug and abandonment obligations; difficulties in integrating the operations and assets of the acquired business and the acquired personnel; limitations on our ability to properly assess and maintain an effective internal
53
control environment over an acquired business; potential losses of key employees and customers of the acquired business; risks of entering markets in which we have limited prior experience; and increases in our expenses and working capital requirements.
In evaluating acquisitions, we generally prepare one or more financial cases based on a number of business, industry, economic, legal, regulatory and other assumptions applicable to the proposed transaction. Although we expect a reasonable basis will exist for those assumptions, the assumptions will generally involve current estimates of future conditions. Realization of many of the assumptions will be beyond our control. Moreover, the uncertainty and risk of inaccuracy associated with any financial projection will increase with the length of the forecasted period. Some acquisitions may not be accretive in the near term and will be accretive in the long-term only if we are able to timely and effectively integrate the underlying assets and such assets perform at or near the levels anticipated in our acquisition projections.
In addition, we may not have sufficient capital resources to complete any additional acquisitions. We may incur substantial indebtedness to finance future acquisitions and also may issue equity, debt or convertible securities in connection with such acquisitions. Debt service requirements could represent a significant burden on our results of operations and financial condition and the issuance of additional equity or convertible securities could be dilutive to our existing stockholders. Furthermore, we may not be able to obtain additional financing on satisfactory terms, or at all. Even if we have access to the necessary capital, we may be unable to continue to identify suitable acquisition opportunities, negotiate acceptable terms or successfully acquire identified targets.
We may be required to take write-downs of the carrying values of our long-lived assets and finite-lived intangible assets.
We evaluate our long-lived assets, such as property and equipment, and finite-lived intangible assets for impairment whenever events or changes in circumstances indicate that their carrying value may not be recoverable. Recoverability is measured by a comparison of their carrying amount to the estimated undiscounted cash flows to be generated by those assets. Based on specific market factors and circumstances at the time of prospective impairment reviews and the continuing evaluation of development plans, economics and other factors, we may be required to write down the carrying value of our long-lived and finite-lived intangible assets. For the years ended December 31, 2025, 2024, and 2023, we recorded impairment and abandonment charges related to long-lived assets and finite-lived intangible assets of $6.2 million, $1.2 million, and $12.6 million, respectively.
We may be required to take a write-down of the carrying value of goodwill.
As of December 31, 2025, our goodwill balance was $48.5 million. When applicable, we conduct our annual goodwill impairment assessment during the fourth quarter of each year, or more frequently if an event or circumstance indicates that the carrying value of a reporting unit may exceed the fair value. When possible impairment is indicated, we value the implied goodwill to compare it with the carrying amount of goodwill. If the carrying amount of goodwill exceeds its implied fair value, an impairment charge is recorded. The fair value of goodwill is based on estimates and assumptions applied by us such as revenue growth rates, operating margins, weighted-average costs of capital, market multiples, and future market conditions and as affected by numerous factors, including the general economic environment and levels of exploration and production activity of oil and gas companies, our financial performance and trends, and our strategies and business plans, among others. As a result of this annual impairment assessment, we may be required to write down the carrying value of goodwill.
ITEM 1B. UNRESOLVED STAFF COMMENTS
None.
54
ITEM 1C. CYBERSECURITY
Processes for Assessing, Identifying, and Managing Cybersecurity Risks
Our industry has become increasingly dependent on digital technologies to conduct certain processing activities. For example, we depend on digital technologies to perform many of our services, to process and record financial and operating data and to collect and store sensitive data, including our proprietary business information and personally identifiable information of our employees and others. We recognize the importance of assessing and managing material risks associated with cybersecurity threats. We seek to assess, identify and manage cybersecurity risks for our IT environment, leveraging the National Institute of Standards and Technology Cyber Security Framework (“NIST CSF”), through the processes described below:
| ● | Risk Assessment: |
| ● | Incident Identification and Response: |
A monitoring and detection system has been implemented to help promptly identify cybersecurity incidents and recommend mitigating actions. Despite our best efforts, no security measure is entirely foolproof. In the event of a cybersecurity incident, we utilize a range of standard incident response practices to attempt to identify, analyze, contain, and recover the event with the goal of minimizing the impact and restoring normal operations.
| ● | Cybersecurity Training and Awareness: |
We require that our employees receive periodic cybersecurity trainings including phishing campaigns and general awareness campaigns.
| ● | Access Controls: |
Users are provided with access consistent with the principle of least privilege, which requires that users be given no more access than necessary to complete their job functions. A multi-factor authentication process has been implemented for employees accessing company information.
Impact of Risks from Cybersecurity Threats
As of the date of this Report, though the Company and our service providers have experienced certain cybersecurity incidents,
55
infallible. See “Risk Factors” for additional information about the risks to our business associated with a breach or compromise to our information or operational technology systems.
Board of Directors’ Oversight and Management’s Role
Our Board of Directors has delegated the responsibility for the oversight of risks from cybersecurity threats and our cybersecurity practices to the
Management is responsible for assessing and managing risks from cybersecurity threats and implementing the Company’s cybersecurity strategies.
ITEM 2. PROPERTIES
We own our headquarters building in Gainesville, Texas, which also houses our remote operating center, and we lease office space in Houston, Texas, as well as local offices across the regions in which we operate.
| ● | Our Water Infrastructure segment includes both owned and leased disposal and recycling facilities, owned landfill assets that support our long-term waste management capabilities and hundreds of miles of pipelines utilizing owned, leased or permitted rights-of-way and easements. The substantial majority of our revenue-producing activities occur at our various water infrastructure facilities, where we process, recycle, manage or dispose of produced water and other waste streams on behalf of our customers or through transportation fees across our infrastructure networks. As of December 31, 2025, we had 130 active SWDs and more than 20 active or under construction recycling facilities. |
| ● | In support of our Water Services segment, we both own and lease a range of field operations facilities that support our various lines of business. The substantial majority of our revenue-generating activities occur at our customers’ locations, where our equipment and personnel are deployed to deliver services directly in the field. |
| ● | In connection with our Chemical Technologies segment, we own two primary manufacturing facilities in Texas and lease three regional distribution centers through which we provide products to customers across all major U.S. shale basins. Our leased properties are subject to various lease terms and expiration dates. Chemicals are either delivered directly to customer locations or applied on-site by our Chemical Technologies personnel as part of our integrated service offering. Our leased properties are subject to various lease terms and expiration dates. |
We believe all the properties that we currently occupy are suitable for their intended uses. We believe that our current facilities are sufficient to conduct our operations. However, we continue to evaluate the purchase or lease of additional properties or the sale or consolidation of our properties, as our business requires.
56
ITEM 3. LEGAL PROCEEDINGS
We are not currently a party to any legal proceedings that, if determined adversely against us, individually or in the aggregate, would have a material adverse effect on our financial position, results of operations or cash flows. We are, however, named defendants in certain lawsuits, investigations and claims arising in the ordinary course of conducting our business, including certain environmental claims and employee-related matters, and we expect that we will be named defendants in similar lawsuits, investigations and claims in the future. While the outcome of these lawsuits, investigations and claims cannot be predicted with certainty, we do not expect these matters to have a material adverse impact on our business, results of operations, cash flows or financial condition. We have not assumed any liabilities arising out of these existing lawsuits, investigations and claims.
ITEM 4. MINE SAFETY DISCLOSURES
Not applicable.
PART II
ITEM 5. MARKET FOR REGISTRANT’S COMMON EQUITY, RELATED STOCKHOLDER MATTERS AND ISSUER PURCHASES OF EQUITY SECURITIES
Our Class A common stock is listed on the New York Stock Exchange (the “NYSE”) under the ticker symbol “WTTR.” As of February 16, 2026, there were 276 stockholders of record of our Class A common stock.
Dividend Policy
The Company’s board of directors initiated a dividend program in 2022 under which the Company intends to pay regular quarterly dividends, which commenced with the first payment of a quarterly cash dividend of $0.05 per share of Class A common stock on November 17, 2022 (along with a comparable distribution of $0.05 per unit for holders of units of SES Holdings, LLC who also hold an equal number of shares of Class B common stock). The Company paid quarterly dividends at the same rate through the third quarter of 2023, then the board of directors increased the quarterly dividend paid on November 17, 2023 to $0.06 per share of Class A common stock (along with a comparable distribution of $0.06 per unit to the unitholders of SES Holdings, LLC). The Company paid quarterly dividends at the same rate through the third quarter of 2024, then the board of directors increased the quarterly dividend paid on November 15, 2024 to $0.07 per share of Class A common stock (along with a comparable distribution of $0.07 per unit to the unitholders of SES Holdings, LLC). The Company most recently announced a quarterly dividend of $0.07 per share on January 22, 2026 to be paid on February 18, 2026 to holders of record as of the close of business on February 6, 2026. Our future dividend policy is within the discretion of our board of directors, and all future dividend payments are subject to quarterly review and approval by our board of directors, and will depend upon then-existing conditions, including our results of operations and financial condition, capital requirements, business prospects, statutory and contractual restrictions on our ability to pay dividends, including restrictions contained in our Sustainability-Linked Credit Facility and other factors our board of directors may deem relevant.
Securities Authorized for Issuance under Equity Compensation Plans
The Company maintains the Select Water Solutions, Inc. 2024 Equity Incentive Plan (as amended, the “2024 Plan”) and the Select Energy Services, Inc. Employee Stock Purchase Plan (the "ESPP”). The 2024 Plan was adopted on March 25, 2024. The ESPP was approved by our stockholders on May 4, 2018. On November 3, 2022, our board of directors approved an amendment to the ESPP, which suspended all offerings on or after December 1, 2022. Our board of directors reserves the right to recommence offerings pursuant to its discretion and the terms of the ESPP. See “Note 12—Equity-Based Compensation” for a description of our equity compensation plans.
57
The following table provides information about our Class A common stock that may be issued under our equity compensation plans as of December 31, 2025.
Plan Category | Number of securities to be issued upon exercise of outstanding options, warrants and rights | Weighted-average exercise price of outstanding options, warrants and rights(1) | Number of securities remaining available for future issuance under equity compensation plans (excluding securities reflected in column (a))(2) |
| (a) | (b) | (c) |
Equity compensation plans approved by security holders | 856,092 | $21.98 | 8,640,281 |
Equity compensation plans not approved by security holders | — | — | — |
Total | 856,092 | $21.98 | 8,640,281 |
(1) | Only stock options have an exercise price. |
(2) | Reflects the total number of shares of Class A common stock (i) subject to outstanding rights under the ESPP and (ii) remaining available for issuance under the 2024 Plan and the ESPP. For the avoidance of doubt, while shares of Class A common stock technically remain available for issuance under the ESPP, the Company does not currently have an offering period open with respect to the ESPP. Shares remaining available under the 2024 Plan may be issued other than with respect to options, warrants or rights. |
Issuer Purchases of Equity Securities
Period | Total Number of Shares Purchased | Weighted-Average Price Paid Per Share(1) | Total Number of Shares Purchased as Part of Publicly Announced Plans or Programs | Maximum Dollar Value of Shares that May Yet be Purchased Under the Plans or Programs(2) | |||||
October 1, 2025 to October 31, 2025 | — | $0.00 | — | $21,177,432 | |||||
November 1, 2025 to November 30, 2025 | 138,038 | $9.62 | — | $21,177,432 | |||||
December 1, 2025 to December 31, 2025 | 10,799 | $10.99 | — | $21,177,432 | |||||
(1) | The average price paid per share includes commissions. |
(2) | On March 21, 2023, our board of directors authorized a share repurchase program of up to $50 million of outstanding shares of Class A common stock. This new authorization was in addition to the $5.1 million remaining outstanding under our previous $25 million authorization, as of March 21, 2023. On November 8, 2023, our board of directors authorized a share repurchase program of up to $25 million of outstanding shares of Class A common stock. This new authorization was in addition to the $7.5 million remaining outstanding under our previous authorization, as of November 8, 2023. As of December 31, 2025, approximately $21.2 remains outstanding under our prior authorizations, in the aggregate. Repurchases under the share repurchase program may be made at any time or from time to time, without prior notice, in the open market or in privately negotiated transactions at prevailing market prices, or such other means as will comply with applicable state and federal securities laws and regulations, including the provisions of the Securities Exchange Act of 1934, including Rule 10b5-1 and, to the extent practicable or advisable, Rule 10b-18 thereunder, and consistent with the Company’s contractual limitations and other requirements. |
58
STOCK PERFORMANCE GRAPH
The following performance graph and related information shall not be deemed “soliciting material” or to be “filed” with the SEC, nor shall the information be incorporated by reference into any future filing under the Securities Act or the Exchange Act, except to the extent that the Company specifically incorporates it by reference into such filing.
Set forth below is a line graph comparing the cumulative total stockholder return for the Company’s Class A common stock, based on the market price of the Class A common stock and assuming reinvestment of dividends, with the cumulative total stockholder return of companies with the New York Stock Exchange Market Value Index (the Company’s broad equity market index) and the Philadelphia Stock Exchange Oil Service Sector Index for the period commencing on December 31, 2020 and ending on December 31, 2025. The stock price performance included in this graph is not necessarily indicative of future stock price performance.
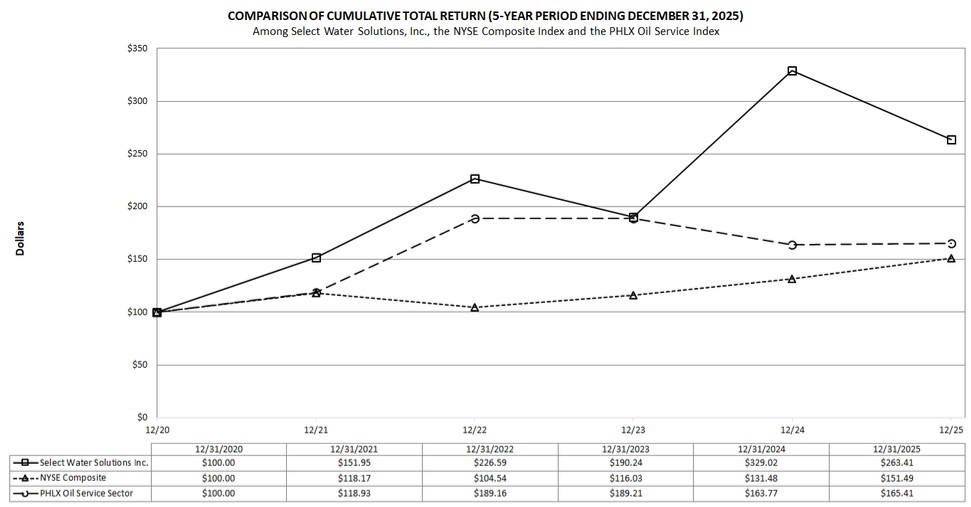
ITEM 6. RESERVED
59
ITEM 7. MANAGEMENT’S DISCUSSION AND ANALYSIS OF FINANCIAL CONDITION AND RESULTS OF OPERATIONS
The following discussion and analysis of our financial condition and results of operations should be read in conjunction with our consolidated financial statements and related notes thereto in Part II, Item 8. “Financial Statements and Supplementary Data”. This discussion and analysis contains forward-looking statements based on our current expectations that involve risks and uncertainties. Our actual results may differ materially from those anticipated in these forward-looking statements as a result of various factors as described under “Cautionary Note Regarding Forward-Looking Statements” and Part I, Item 1A. “Risk Factors.” The following information updates the discussion of our financial condition provided in our previous filings, and analyzes the changes in the results of operations between the years ended December 31, 2025 and 2024. Refer to our 2024 Annual Report filed February 19, 2025 for discussion and analysis of the changes in results of operations between the years ended December 31, 2024 and 2023. We assume no obligation to update any of these forward-looking statements.
Overview
We are a leading provider of sustainable water and chemical solutions to the energy industry in the U.S. As a leader in the water solutions industry, we place the utmost importance on safe, environmentally responsible management of oilfield water throughout the lifecycle of a well. Additionally, we believe that responsibly managing water resources through our operations to help conserve and protect the environment in the communities in which we operate is paramount to our continued success.
Across many of the regions in which we operate, there is growing concern surrounding the volumes of water required for new well completions, as well as the volumes of produced water injected into subterranean formations where induced seismicity may occur. In response, we are working collaboratively with our customers and local communities to advance more sustainable, cost-effective water management solutions that reduce both freshwater consumption and disposal volumes. Through our integrated infrastructure networks, we provide permanent and mobile solutions that enable the gathering, treatment, and reuse of produced water, which in turn reduces demand for freshwater resources and limits reliance on saltwater disposal wells. In select regions, we have also secured access to non-potable alternative water sources, including brackish groundwater and municipal or industrial effluent, to further support water reuse and reduce competition for freshwater. Leveraging our in-house chemical expertise and proprietary FluidMatch™ design platform, we provide tailored water profiling, treatment assessment, and fluid system optimization to enable the economic use of these alternative sources without compromising well performance. Additionally, we help our customers lower emissions and minimize environmental impact through the deployment of combustion solutions for field-based methane control and the use of temporary layflat hose systems and permanent pipeline infrastructure. These water delivery systems are supported by our real-time automation and remote monitoring technologies, including leak detection, pressure monitoring, and volume tracking, which enhance the safety, reliability, and efficiency of our operations. By reducing the reliance on trucked water logistics, these solutions materially reduce greenhouse gas emissions, improve public safety, and help limit traffic congestion and road damage in the local communities where we operate.
Recent Developments
Recent Acquisitions
During 2025, we executed a series of strategic asset acquisitions totaling $25.4 million to expand our water infrastructure footprint across both the Permian Basin and the Northeast Region. In the Permian, we acquired surface acreage, multiple SWDs, water storage assets, and a pipeline system connecting a key customer’s operations to a Select recycling facility. These assets are located across Lea County and Eddy County in New Mexico, as well as Howard County, Upton County, and Winkler County in Texas, further strengthening our integrated network of treatment, disposal, gathering, and recycling infrastructure in core production areas of the Permian Basin. In addition, certain acquired SWD sites allow for the potential development of additional wells or recycling facilities in the future. In the Northeast, we acquired three SWDs in Ohio, expanding our market leading disposal presence in the region. Collectively, these transactions enhance Select’s ability to deliver full-cycle water management solutions across its footprint,
60
supporting both near-term operations and long-term growth. Additionally, we also acquired certain wastewater treatment facilities for the accommodation and rentals business line in the Permian and Eagle Ford regions for $1.7 million.
Omni Transaction
On July 1, 2025, we acquired a high-margin Bakken platform anchored by long-lived infrastructure from Omni: a special-waste landfill with approximately 3.2 million cubic yards of remaining capacity, a processing and recovery facility for reclaiming diesel and other hydrocarbons from oilfield waste, a permitted Class II SWD with capacity of approximately 12,000 barrels per day, and a commercial tank farm with approximately 24,000 barrels of oil storage. As part of the same transaction, we divested certain lower-margin operations including trucking operations in the Bakken, Northeast and MidCon regions, rental operations in the Bakken and one MidCon SWD. Approximately 280 fluids-hauling employees moved with those businesses, which together represented approximately 8 percent of Water Services segment revenue in the first half of 2025. This transaction expanded our market leading solids management business in the Bakken, while reducing exposure to noncore trucking and hauling.
Streamline Fluids Hauling
As part of our continued focus on capital discipline and portfolio optimization, we also took steps to streamline our fluids hauling operations to prioritize higher-margin, infrastructure-integrated markets. Specifically, we wound down our fluids hauling operations in the Haynesville region and divested the remaining lower-margin operations in the MidCon region. We continue to operate our more integrated and higher-margin fluids hauling businesses in the Permian, Rockies, and Eagle Ford regions, where these services are closely aligned with our operational infrastructure.
See “Note 3—Acquisitions” for further discussion.
AV Farms Investment
In February 2025, we made a $72.1 million equity method investment in a newly formed partnership focused on consolidating and commercializing a large-scale portfolio of senior water rights, irrigated farmland, and reservoir storage assets in Colorado. The investment, centered in the Arkansas River Valley region, is intended to support long-term water infrastructure development and reliable delivery to agricultural, municipal, and industrial stakeholders. As of December 31, 2025, we had contributed $72.1 million to AV Farms and held an approximate 39% ownership interest in the partnership and a 25% interest in the general partner. We expect to contribute up to an additional $74 million over a multi-year period to support future water rights acquisitions and infrastructure buildout. The governing agreements also include call and put option structures beginning in 2028 that could result in our acquisition of the remaining ownership interests, subject to defined valuation mechanics and partial equity settlement provisions. This investment reflects our strategic focus on long-term water resource development and positions us to participate in sustainable water solutions across high-priority basins in the Western United States (Refer to “Note 2—Significant Accounting Policies” for further discussion on AV Farms).
Peak Rentals Update
In August 2025, we announced that we had started an evaluation of strategic alternatives for Peak Rentals, our equipment rental and distributed power business within the Water Services segment. Peak currently includes our accommodations and rentals platform, as well as our well testing and flowback operations. This evaluation includes a range of potential paths forward, including capital structure initiatives and other portfolio optimization opportunities. As of December 31, 2025, no transaction is pending or imminent, and we continue to own 100% of the business. We are continuing to evaluate strategic alternatives for Peak Rentals in the ordinary course; however, there can be no assurance that any particular outcome will ultimately be pursued or completed.
New Sustainability-Linked Credit Facility
On January 24, 2025, we entered into a $550.0 million sustainability-linked senior secured credit facility and extinguished our prior debt. The new facility consists of a $300.0 million revolving credit facility and a $250.0 million
61
term loan, both with a five-year maturity, and provides the flexibility to upsize by an additional $200.0 million. Proceeds from the term loan were used to repay all outstanding borrowings under our prior facility, which was concurrently terminated. This new structure enhances our liquidity position and extends our maturity profile through 2030. It also better aligns our capital structure with our long-term infrastructure growth strategy by supporting investment in contracted, production-linked assets and enhancing our flexibility to pursue disciplined, return-focused capital deployment (Refer to “Note 10—Debt” for further discussion of the Sustainability-Linked Credit Facility).
Infrastructure Investments and Contracted Growth Initiatives
Select is prioritizing investments in Water Infrastructure projects, which often bring a more predictable and steady revenue stream through long-term contracts and production-related operations. These investments typically produce higher gross margins and also foster stronger partnerships with customers, as Select becomes an integral partner in ensuring well productivity for ongoing customer production over the life of a well. Our focus is on integrated solutions that enhance contracted infrastructure projects with logistics services and chemical solutions, and expanding the value we provide to our customers. Our approach has been to streamline operations and offer a more comprehensive and valuable overall package to customers that is built around optimizing the entire water lifecycle, as such integrated solutions drive revenue growth and enhance overall value to clients.
During 2025 and 2024, Select has made strategic Water Infrastructure investments across five of the seven regions in which we operate. A summary of the resulting system capacity and current state of operations and resulting competitive advantages is outlined below.
Permian
The Permian remains our largest and most strategically important Water Infrastructure region, anchored by a fully integrated network of 43 active SWDs, 17 active recycling facilities, as well as pipeline connectivity both within our system and with key customer infrastructure. We signed multiple new long-term customer agreements throughout 2025, including dedicated acreage, ROFR acreage and MVCs. A number of these commercial arrangements are expected to commence in 2026 and are anticipated to drive incremental system utilization, expand our high-margin recurring revenue base, and deepen customer relationships across the basin.
The platform was expanded through the 2024 acquisition of Trinity, which added SWDs, pipelines and customer connectivity. During 2025, we completed seven additional bolt-on acquisitions, further enhancing our regional scale and footprint across disposal and pipeline infrastructure. These transactions were highly complementary and have strengthened our ability to provide integrated solutions with improved connectivity to both new and existing customer operations. As of December 31, 2025, our total recycling capacity was approximately 2.4 million barrels per day, with total storage capacity of approximately 35 million barrels. Additionally, we are continuing to drill new SWDs and build new recycling facilities.
Haynesville
Including the Iron Mountain, and Tri-State acquisitions completed in 2024, we have established the largest disposal footprint in the Haynesville region. We now operate an integrated network of disposal assets, the majority of which are tied into basin-wide gathering infrastructure. As of 2025, our Haynesville system includes over 23 active SWDs supported by a regional pipeline network anchored by a 60-mile buried produced water gathering system. We also have a solids facility that processes drilling muds and water, removes solids for landfill disposal, and injects the remaining fluids into our SWDs. This scaled platform enhances flow assurance, improves route density, and strengthens commercial alignment with key customers across the region. Additionally, we are continuing to drill new SWDs in strategic locations to accommodate customer activity.
Looking ahead, we expect increased basin activity, supported by improved natural gas pricing and demand, to drive increased produced water volumes and higher system demand. Our existing gathering
62
footprint, available disposal capacity, and flexible operating model position us to capture additional volumes while leveraging the operational efficiencies of the system.
Bakken
We continued to scale our Water Infrastructure platform in the Bakken throughout 2024 and 2025 through a combination of targeted acquisitions and organic growth initiatives. On March 1, 2024, we closed the acquisition of Buckhorn, expanding our permitted landfill footprint across North Dakota and Montana and integrating those assets into our existing solids waste network. This was followed by the acquisition of Omni on July 1, 2025, which added a high-capacity landfill, a hydrocarbon recovery and processing facility, one saltwater disposal well, and a commercial oil storage site. Following these transactions, we now operate four permitted landfills and 22 active SWDs in the region, and an expansive freshwater pipeline distribution network. This positions us as the market leader of full-cycle water and waste infrastructure solutions in the Bakken, with integrated capabilities across pipeline transportation, disposal, recovery, and solids handling. The expanded footprint enhances commercial alignment with key operators in the basin, and we are actively evaluating opportunities to broaden the range of accepted waste streams at our landfills to drive incremental revenue, increase throughput, and improve overall asset utilization.
Northeast
Following the Nuverra acquisition, a business combination and two asset acquisitions in 2024 that added three SWDs, and a subsequent asset acquisition in 2025 that added three additional SWDs, Select has established a scaled disposal platform in the Northeast. Our current operations include 21 active SWDs, representing the largest disposal network in the region. Additionally, we operate a permitted landfill that offers waste handling solutions tailored to the oil and gas industry. The expanded footprint enhances our ability to provide reliable disposal and produced water solutions to Northeast operators. Produced water volumes in the region are primarily delivered via truck, with limited pipeline connectivity, which continues to shape the commercial and operating model for the area.
Rockies
Effective January 1, 2024, we acquired two saltwater disposal wells along with acreage that offers future expansion potential. Our Rockies platform now includes three active SWDs, a recycling facility and a mobile recycling system, with an additional SWD expected to come online in the first quarter of 2026. We leverage a combination of customer integration points and available third-party infrastructure to enhance gathering, disposal and recycling connectivity. These efforts are improving alignment with key customers and supporting more efficient system utilization across the region.
Market Trends and Outlook
We are navigating through various evolving external factors that create uncertainty and volatility in our operating environment, including, but not limited to, global geopolitical conflicts, volatility in energy prices and inflation due to geopolitical dynamics, increased tariffs and their impact on costs of goods and services and developing trends among our customers, including increased consolidation in the industry and demand for produced water recycling services.
The armed conflict between Ukraine and Russia has continued into 2026, as well as ongoing conflicts in the Middle East, including heightened tensions with Iran. As a result of the Russian invasion of Ukraine, the U.S., the United Kingdom, the member states of the European Union and other public and private actors have imposed severe sanctions on Russian financial institutions, businesses and individuals. In the Middle East, various conflicts have resulted in increased hostilities and instability in oil and gas producing regions in the Middle East as well as in key adjacent shipping lanes and supply chains, including elevated tensions with Iran, a major oil producer. In addition, in July of 2025, the U.S. government threatened additional sanctions on Russia and additional tariffs on countries that import energy from Russia.
63
The Russia-Ukraine conflict, and the resulting sanctions and concerns regarding global energy security, have contributed to, and conflicts in the Middle East may contribute to, increases and volatility in the prices for oil and natural gas. Further, beginning in late 2025, the U.S. seized several oil tankers suspected of transporting oil from Venezuela, and, in early 2026, the U.S. launched a limited military intervention in Venezuela which culminated in the capture of Venezuela’s incumbent president. As the situation stabilizes and U.S.-Venezuela relations improve, it is expected that approximately 50 million barrels of sanctioned oil may become available for export as U.S. sanctions are lifted. The resumption of such exports may cause a depression in global oil prices as the market adjusts to such an increase in supply. Such volatility, coupled with an increased cost of capital, due, in part to elevated rates of inflation and interest rates, may lead to a more difficult investing and planning environment for us and our customers. The ultimate geopolitical and macroeconomic consequences of these conflicts and associated sanctions and/or international responses cannot be predicted, and such events, or any further hostilities elsewhere, could severely impact the world economy and may adversely affect our financial condition. An end to these conflicts and an easing or elimination of the related sanctions and/or international response could result in a significant fall in commodity prices as hydrocarbons become more readily accessible in global markets, which could have an adverse effect on our customers, and therefore adversely affect our customers’ demand for our services. An intensification of that conflict could also have an adverse effect on our customers and their demand for our services.
Since 2021, OPEC+ countries have instituted production cuts (as well as voluntary production cuts), which currently cut output by approximately 3.2 million barrels/day in the aggregate. Most recently, in November 2025, OPEC+ announced it would maintain current oil production cuts of approximately 3.2 million barrels per day and reaffirmed its decision to not increase production. OPEC+ may, at its discretion, continue to decrease, or increase, production, which will continue to impact crude oil and natural gas price volatility. The actions of OPEC+ countries with respect to oil production levels and announcements of potential changes in such levels, including agreement on and compliance with production targets, may result in volatility in the industry in which we and our customers operate. The average price of WTI crude oil decreased in 2025 versus 2024 due to a combination of factors, including heightened trade tensions, weakening global demand, rising domestic and global production, the threat of a global recession and increased production from OPEC+ countries and the gradual unwinding of OPEC+ production cuts. During the year ended December 31, 2025, the average spot price of WTI crude oil was $65.39 versus an average price of $76.63 for the year ended December 31, 2024. The average Henry Hub natural gas spot price during the year ended December 31, 2025 was $3.52 versus an average of $2.19 for the year ended December 31, 2024. Henry Hub natural gas price levels in 2025 have increased relative to 2024 due to a variety of factors, including increased demand driven by power consumption, sanctions on Russian hydrocarbons, severe weather events, infrastructure disruptions, lower than expected inventories, and the ongoing liquified natural gas (“LNG”) export growth in the U.S., and have positively impacted activity levels in natural gas basins.
Global macroeconomic developments, such as the development or change in international trade policies, including the imposition of tariffs, may adversely affect our ability to source raw materials and the demand for our services. While we have positioned ourselves to largely not be reliant on any sole supplier and believe we would be able to find alternative sources for our raw materials, any trading disruption (such as tariffs, product restrictions, etc.) in the trading relationships between the U.S. and other nations may adversely impact our business. For instance, beginning in the first quarter of 2025, the U.S. imposed new or additional tariffs, through executive orders, on a variety of imported raw materials and products, including steel and aluminum. In response to the U.S. tariffs on steel and aluminum, the European Union and several other countries, including Canada and China, have threatened and/or imposed retaliatory tariffs. We continue to monitor the effects of the ever-evolving global trade landscape, including with respect to sanctions, tariffs, existing trade agreements, anti-dumping and countervailing duty regulations and more. President Trump has threatened additional increased tariffs on goods imported from China as result of current Chinese trade policy. A portion of those tariffs might by overturned depending on the resolution of certain U.S. litigation. Specifically, the U.S. Supreme Court has agreed to hear a case determining whether a federal law giving the president certain emergency powers allowed President Trump to levy tariffs on nearly all goods imported into the United States through a series of executive orders. Tariffs and any additional changes in U.S. trade policy could result in one or more other jurisdictions adopting responsive trade policies. The adoption and expansion of trade restrictions, the occurrence of a trade war, or other governmental action related to tariffs or trade agreements or policies has the potential to adversely impact us and the global economy.
64
Additionally, heightened inflation in recent years has resulted in higher interest rates and increased cost of capital for Select and for our customers. As costs of capital have increased, many of our customers have demonstrated their resolve to manage their capital spending within budgets and cash flow from operations and increase redemptions of debt and/or returns of capital to investors. Furthermore, consolidation among our customers, such as the consolidation of E&P companies in the Permian Basin, can disrupt our market in the near term and the resulting demand for our services. When one customer acquires another, drilling and completions activity levels may decrease overall, but acquisitions can lead to larger blocks of consolidated development and production acreage, which can increase the demand for our longer-term integrated full water lifecycle solutions. This consolidation may streamline operations, as Select can offer integrated solutions to clients with larger water volumes to manage in certain areas. The Company’s position in the market may strengthen, as it becomes an essential partner for long-term production integrity in larger, more comprehensive water projects. However, it also means Select must meet the changing needs and structures of these consolidated entities to maintain and grow these relationships. While customers involved in acquisitions may initially slow activity to focus on integration and portfolio management, we believe we are well-positioned to meet the increased responsibilities of overall water management, including water reuse, recycling, transmitting and balancing across customers and regions, and ultimately disposal, for these larger customers and blocks of contiguous acreage.
Overall, however, even though commodity prices have moderated recently, the financial health of the oil and gas industry is in a generally healthy position, including many of our customers specifically, as reflected in revenues and earnings, debt metrics, recent capital raises, and recurring shareholder returns. The industry may face additional changes due to recent and future legislative and regulatory changes under the current presidential administration. Most recently, the OBBBA, signed into law in July 2025, includes many provisions intended to expand onshore oil and gas leasing and drilling on federal land, such as increased federal oil and gas lease sales and lower royalty rates on federal oil and gas leases. While the financial health of the broader oil and gas industry has shown improvement as compared to prior periods, central bank policy actions and associated liquidity risks and other factors may negatively impact the value of our equity and that of our customers, and may reduce our and their ability to access liquidity in the bank and capital markets or result in capital being available on less favorable terms, which could negatively affect our financial condition and that of our customers.
From an operational standpoint, many of the recent efficiency trends still apply to ongoing unconventional oil and gas development. The continued trend towards multi-well pad development and simultaneous well completions, executed within a limited time frame, combined with service price inflation and elevated interest rates, has increased the overall intensity, complexity and cost of well completions, while increasing fracturing efficiency and the use of lower-cost in-basin sand has decreased total costs for our customers. However, we note the continued efficiency gains in the well completions process can limit the days we spend on the wellsite and, therefore, negatively impact the total revenue opportunity for certain of our services utilizing day-rate pricing models.
This multi-well pad development, combined with upstream acreage consolidation and corporate mergers as well as the growing trends around the recycling and reuse applications of produced water provides a significant opportunity for companies like us that can deliver increasingly complex solutions for our E&P customers across large swathes of acreage through our regional infrastructure networks, delivering solutions for the full completion and production lifecycle of wells. While these trends have advanced the most in the Permian Basin to date, they are emerging in other basins as well and Select has recently performed recycling projects in the Haynesville, Rockies and South Texas regions as well.
The increased reuse of produced water requires additional chemical treatment solutions. We have a dedicated team of specialists focused every day on developing and deploying innovative water treatment and reuse services for our customers. Our FluidMatch™ design solutions enable our customers to economically use these alternative sources to optimize their fluid systems by providing water profiling and fluid assessment services working towards real-time. This trend also supports more complex “on-the-fly” solutions that treat, proportion, and blend various streams of water and chemicals at the wellsite. This complexity favors service companies that are able to provide advanced technology solutions. Ultimately, we intend to play an important role in the advancement of water and chemical solutions that are designed to meet the sustainability goals of key stakeholders.
65
Our water logistics, treatment, and chemical application expertise, in combination with advanced technology solutions, are applicable to other industries beyond oil and gas. We are working to further commercialize our services in other businesses and industries through our industrial solutions group and equity method investments.
Our Segments
Our services are offered through three reportable segments: (i) Water Infrastructure; (ii) Water Services; and (iii) Chemical Technologies.
| ● | Water Infrastructure. The Water Infrastructure segment consists of the Company’s fixed infrastructure assets, including operations associated with our water distribution pipeline infrastructure, our water recycling facilities, our produced water gathering pipelines, SWDs, and our solids management facilities, primarily serving E&P companies. |
| ● | Water Services. The Water Services segment primarily consists of the Company’s water-related services businesses, including water sourcing, water transfer, fluids hauling, water monitoring, water containment and water network automation, primarily serving E&P companies. Additionally, this segment includes the operations of our Peak Rentals businesses. |
| ● | Chemical Technologies. The Chemical Technologies segment provides technical solutions, products and expertise related to chemical applications in the oil and gas industry. We develop, manufacture, manage logistics and provide a full suite of chemicals used in hydraulic fracturing, stimulation, cementing and well completions for customers ranging from pressure pumpers to major integrated and independent oil and gas producers. This segment also utilizes its chemical experience and lab testing capabilities to customize tailored water treatment solutions designed for the recycling and treatment of produced water and to optimize the fracturing fluid system in conjunction with the quality of water used in well completions. |
How We Generate Revenue
| ● | Water Infrastructure. The Water Infrastructure segment comprises our extensive infrastructure network, including produced water gathering pipelines, water distribution lines, water recycling facilities, saltwater disposal wells, and solids management operations. We primarily generate revenue through fixed fees per barrel handled, which may include gathering, transportation, recycling, or disposal, pursuant to long-term commercial agreements that may incorporate acreage dedications, MVCs, and periodic escalators. Additional revenue is earned from the sale of skim oil, based on the volume of skim oil sold at prevailing market rates, as well as from recycled water sales and capacity optimization on an interruptible basis. Revenue is recognized as volumes are received and processed across our network. |
Contract structures becoming more prevalent in our Water Infrastructure segment include dedicated acreage, ROFRs, interruptible agreements, MVCs, wellbore dedications, AMIs and WPAs. These contracts underpin the economics of our newly built facilities to an anchor tenant, with the opportunity for further commercialization of the asset. Most of our contracts are an acreage dedication structure, and we often utilize a ROFR structure in tandem with these dedications to secure upside with our customers should they expand their activities outside the dedicated acreage position.
66
Dedicated Acreage
We believe in the geology we’re investing in and, as such, view acreage dedications as the optimal structure for both us and our customers, as they align long-term development incentives on both sides. Under these agreements, the operator is generally obligated to deliver produced water to us for recycling or disposal, and to take treated water from us for completions within the dedicated position. Importantly, for most of our contracts, we hold the right, but not the obligation, to accept water under these dedications, meaning we are not penalized in the event we’re unable to take water we cannot consume. That said, we do have a limited number of firm takeaway commitments, under which we incur monetary penalties for failure to perform. Due to the high quality of our dedicated acreage positions, we typically see strong and consistent activity levels and maintain a backlog of high-confidence well inventory. Dedicated acreage remains our most common contract structure, with tier-one inventory conversion, and development is a matter of when, not if.
ROFR
ROFR acres provide potential upside to our dedicated acreage revenue stream and are incorporated in many of our acreage dedication contract structures. These are typically acreage positions in proximity to the core dedicated area, but are often excluded initially due to their later place in the development timeline. Should the anchor customer expand or initiate operational activity within the ROFR area, we generally hold the first right to build out the necessary water infrastructure to support that activity. Subject to mutual agreement on the exercise of the ROFR, that acreage is then converted to Dedicated Acreage under the original contract framework. We typically see ROFR conversion through operator expansion on adjacent leaseholds, acreage trades, or acquisitions that fall within ROFR boundaries. While less certain than committed dedicated volumes, ROFRs represent meaningful incremental upside to our contracted revenue base.
Interruptible Agreements
Interruptible agreements allow new or existing customers into our system to take advantage of our expansive water networks for produced water disposal and/or recycling. Operators can tie-in, and we can provide treated water for completions or accept produced water into our system for disposal or treatment. Our anchor tenants will typically continue to have primary rights to both our disposal and recycling capacity for their continued operations. Interruptible contracts are our way of commercializing the product we have created, particularly in the Northern Delaware Basin.
MVCs
Contractual arrangements under which an operator commits to receive or deliver a defined minimum volume of water-related services, typically measured in barrels, with predetermined financial true-up mechanisms for any shortfall below the committed volumes. These MVCs encompass the sourcing, supply, transportation, recycling, and disposal of water used across the operator’s drilling, completion, and production activities.
Wellbore dedication
The dedication of specifically identified wells owned or operated by a customer whereby all water required to complete the wells or produced by the wells are dedicated to Select.
AMIs
Designated areas in which producers will dedicate subsequently acquired or leased acreage and oil and natural gas wells to Select.
WPA
Water purchase agreements where customers agree to purchase water.
67
| ● | Water Services. The Water Services segment comprises our short-cycle, field-based service offerings, including water transfer, water sourcing, fluids hauling, monitoring, containment, water-network automation and the services associated with Peak Rentals. We generally earn revenue via market-based day rates, time-and-materials, or per-barrel delivered under MSAs and short-term work orders. Peak Rentals’ services are typically billed per job/day plus consumables. Revenue is recognized as services are performed at customer sites. |
| ● | Chemical Technologies. The Chemical Technologies segment provides technical products and services for hydraulic fracturing, stimulation, cementing and completions, serving pressure pumpers and E&P operators. Revenue is primarily price-per-unit of chemicals delivered or consumed, supplemented by application engineering, lab testing and field service fees, under short-term supply arrangements and MSAs. We also formulate and supply tailored water-treatment chemistries that support produced-water recycling and optimization of fracturing fluids. Revenue is recognized upon delivery or consumption of product and performance of services. |
Costs of Conducting Our Business
The principal expenses involved in conducting our business are labor costs, vehicle and equipment costs (including depreciation, rental, repair and maintenance and leasing costs), raw materials including water sourcing costs and fuel costs. Overall, our fixed costs are relatively low and most of the costs of serving our customers are variable, i.e., they are incurred only when we provide water and water-related services, or chemicals and chemical-related services to our customers.
Labor costs associated with our employees and contract labor comprise the largest portion of our costs of doing business. We incurred labor and labor-related costs of $484.2 million, $530.7 million and $554.4 million for the years ended December 31, 2025, 2024 and 2023, respectively. The majority of our recurring labor costs are variable and dependent on the market environment and are incurred only while we are providing our operational services. We also incur costs to employ personnel to ensure safe operations, sell and supervise our services and perform maintenance on our assets, which is not directly tied to our level of business activity. Additionally, we incur selling, general and administrative costs for compensation of our administrative personnel at our field sites and in our operational and corporate headquarters, as well as for third-party support, permitting, licensing and services.
We incur significant vehicle and equipment costs in connection with the services we provide, including depreciation, repairs and maintenance, rental and leasing costs. We incurred vehicle and equipment costs of $306.0 million, $312.9 million and $318.9 million for the years ended December 31, 2025, 2024 and 2023, respectively.
We incur raw material costs in manufacturing our chemical products, as well as for water that we source for our customers. We incurred raw material costs of $255.2 million, $242.7 million and $299.9 million for the years ended December 31, 2025, 2024 and 2023, respectively.
We incur variable transportation costs associated with our service lines, predominately fuel and freight. We incurred fuel and freight costs of $75.0 million, $83.4 million and $115.6 million for the years ended December 31, 2025, 2024 and 2023, respectively. Changes to fuel prices impact our transportation costs, which affect the results of our operations.
68
How We Evaluate Our Operations
We use a variety of operational and financial metrics to assess our performance. Among other measures, management considers each of the following:
| ● | Revenue; |
| ● | Gross Profit; |
| ● | Gross Margins; |
| ● | Earnings before Interest, Taxes, Depreciation and Amortization (“EBITDA”); |
| ● | Adjusted EBITDA; |
| ● | Cash Flows; and |
| ● | Free Cash Flow. |
Revenue
We analyze our revenue and assess our performance by comparing actual monthly revenue to our internal projections and across periods. We also assess incremental changes in revenue compared to incremental changes in direct operating costs and selling, general and administrative expenses across our reportable segments to identify potential areas for improvement, as well as to determine whether segment performance is meeting management’s expectations.
Gross Profit
To measure our financial performance, we analyze our gross profit, which we define as revenues less direct operating expenses (including depreciation, amortization and accretion expenses). We believe gross profit provides insight into profitability and the true operating performance of our assets. We also compare gross profit to prior periods and across segments to identify trends as well as underperforming segments.
Gross Margins
Gross margins provide an important gauge of how effective we are at converting revenue into profits. This metric works in tandem with gross profit to ensure that we do not seek to increase gross profit at the expense of lower margins, nor pursue higher gross margins at the expense of declining gross profits. We track gross margins by segment and service line and compare them across prior periods and across segments and service lines to identify trends as well as underperforming segments.
EBITDA and Adjusted EBITDA
We view EBITDA and Adjusted EBITDA as important indicators of performance. We define EBITDA as net income/(loss), plus interest expense, income taxes, and depreciation, amortization and accretion. We define Adjusted EBITDA as EBITDA plus any impairment and abandonment charges or asset write-offs pursuant to U.S. Generally Accepted Accounting Principles (“GAAP”), plus non-cash losses on the sale of assets or subsidiaries less remeasurement gains on fixed assets related to business combinations, non-cash compensation expense, and non-recurring or unusual expenses or charges, including severance expenses, transaction costs, or facilities-related exit and disposal-related expenditures, plus/(minus) foreign currency losses/(gains), plus/(minus) losses/(earnings) on unconsolidated entities and plus TRAs expense. The adjustments to EBITDA are generally consistent with such adjustments described in our Sustainability-Linked Credit Facility. See “—Comparison of Non-GAAP Financial Measures—EBITDA and Adjusted
69
EBITDA” for more information and a reconciliation of EBITDA and Adjusted EBITDA to net income, the most directly comparable financial measure calculated and presented in accordance with GAAP.
Cash Flows and Free Cash Flow
We define FCF as net cash provided by (used in) operating activities less purchases of property and equipment, plus proceeds received from sale of property and equipment. Our board of directors and executive management team use FCF to assess our liquidity and ability to repay maturing debt, fund operations and make additional investments. We believe FCF provides useful information to investors because it is an important indicator of our liquidity including our ability to reduce net debt, make strategic investments, pay dividends and distributions and repurchase common stock. Our measure of FCF may not be directly comparable to similar measures reported by other companies. Furthermore, FCF is not a substitute for, or more meaningful than, net cash provided by (used in) operating activities nor any other measure prescribed by GAAP, and there are limitations to using non-GAAP measures such as FCF. Accordingly, FCF should not be considered a measure of the income generated by our business or discretionary cash available to it to invest in the growth of our business.
Factors Affecting the Comparability of Our Results of Operations to Our Historical Results of Operations
Our future results of operations may not be comparable to our historical results of operations for the periods presented, primarily for the reasons described below and those described in “—Recent Developments” above.
Acquisition Activity
As described above, we continuously evaluate potential investments, particularly in water infrastructure and other water-related services and technology. To the extent we consummate acquisitions, any pre-transaction revenues or expenses from such transactions are not included in our historical results of operations.
Between January 2024 and December 2025, we completed seven business combinations and approximately eighteen asset acquisitions. Our historical financial statements for periods prior to the respective date each acquisition was completed do not include the results of operations of that acquisition. See “—Recent Developments” and “Note 3—Acquisitions” for a description of these transactions.
70
Results of Operations
The following table sets forth our results of operations, including revenue by segment, for the year ended December 31, 2025 compared to the year ended December 31, 2024. The results of operations for the year ended December 31, 2024 compared to the year ended December 31, 2023 is set forth in Part II, Item 7 of our Annual Report on Form 10-K for the fiscal year ended December 31, 2024 under the caption “Management’s Discussion and Analysis of Financial Condition and Results of Operations.”
Year Ended December 31, 2025 Compared to the Year Ended December 31, 2024
Year ended December 31, | Change |
| |||||||||||
| 2025 | | 2024 | | Dollars | | Percentage |
| |||||
(in thousands) |
| ||||||||||||
Revenue |
| |
| |
| |
| | |||||
Water Infrastructure | $ | 313,239 | $ | 290,900 | $ | 22,339 | 7.7 | % | |||||
Water Services | 786,525 | 901,657 | (115,132) |
| (12.8) | % | |||||||
Chemical Technologies | 307,580 | 259,518 |
| 48,062 |
| 18.5 | % | ||||||
Total revenue |
| 1,407,344 |
| 1,452,075 |
| (44,731) |
| (3.1) | % | ||||
Costs of revenue |
| |
| |
|
| |||||||
Water Infrastructure | 143,940 | 137,573 |
| 6,367 |
| 4.6 | % | ||||||
Water Services |
| 635,225 |
| 720,876 |
| (85,651) |
| (11.9) | % | ||||
Chemical Technologies | 251,284 | 220,617 | 30,667 | 13.9 | % | ||||||||
Depreciation, amortization and accretion |
| 174,497 |
| 153,543 |
| 20,954 |
| 13.6 | % | ||||
Total costs of revenue |
| 1,204,946 |
| 1,232,609 |
| (27,663) |
| (2.2) | % | ||||
Gross profit |
| 202,398 |
| 219,466 |
| (17,068) |
| (7.8) | % | ||||
Operating expenses |
| |
| |
|
| |||||||
Selling, general and administrative |
| 161,316 | 159,978 |
| 1,338 |
| 0.8 | % | |||||
Depreciation and amortization |
| 5,321 | 3,404 |
| 1,917 |
| 56.3 | % | |||||
Impairments and abandonments | 6,221 | 1,237 | 4,984 | NM | |||||||||
Lease abandonment costs |
| 734 | 358 |
| 376 |
| 105.0 | % | |||||
Total operating expenses |
| 173,592 |
| 164,977 |
| 8,615 |
| 5.2 | % | ||||
Income from operations |
| 28,806 |
| 54,489 |
| (25,683) |
| (47.1) | % | ||||
Other income (expense) |
| |
| |
|
| |||||||
Gain on sales of property and equipment and divestitures, net | 10,338 | 3,255 | 7,083 |
| NM | ||||||||
Interest expense, net |
| (23,181) | (6,965) |
| (16,216) |
| 232.8 | % | |||||
Remeasurement gain on business combination | 14,924 | — | 14,924 |
| NM | ||||||||
Tax receivable agreements expense | (4,995) | (836) | (4,159) |
| NM | ||||||||
Other |
| (1,141) | (573) |
| (568) |
| NM | ||||||
Income before income tax benefit (expense) and equity in losses of unconsolidated entities |
| 24,751 |
| 49,370 |
| (24,619) |
| (49.9) | % | ||||
Income tax benefit (expense) |
| 1,608 |
| (13,568) |
| 15,176 |
| (111.9) | % | ||||
Equity in losses of unconsolidated entities | (4,892) |
| (352) |
| (4,540) |
| NM | ||||||
Net income | $ | 21,467 | $ | 35,450 | $ | (13,983) |
| (39.4) | % | ||||
Revenue
Our revenue decreased $44.7 million, or 3.1%, to $1.407 billion for the year ended December 31, 2025, compared to $1.452 billion for the year ended December 31, 2024. The decrease was composed of a $115.1 million decrease in Water Services revenue partially offset by a $48.1 million increase in Chemical Technologies revenue and a $22.3 million increase in Water Infrastructure revenue. The net $44.7 million decrease was driven primarily by
71
macroeconomic conditions, including fewer hydraulic fracturing crews, as well as divested Fluids Hauling operations from the Omni transaction, partially offset by increases as a result of recent capital investments as well as the ramp-up of long-term contractual agreements in our Water Infrastructure segment and enhanced sales performance in Chemical Technologies. For the year ended December 31, 2025, our Water Infrastructure, Water Services and Chemical Technologies revenues constituted 22.3%, 55.9% and 21.9% of our total revenue, respectively, compared to 20.0%, 62.1% and 17.9%, respectively, for the year ended December 31, 2024. The revenue changes by reportable segment are as follows:
Water Infrastructure. Revenue increased by $22.3 million, or 7.7%, to $313.2 million for the year ended December 31, 2025, compared to $290.9 million for the year ended December 31, 2024. The increase was primarily driven by higher recycling revenue, supported by long-term contracts and the continued organic buildout of our recycling infrastructure, as well as higher disposal and solids revenues reflecting contributions from recently acquired assets. These gains were partially offset by a combination of macroeconomic factors, including a reduction in hydraulic fracturing crews impacting activity and key customer activity timing and reduced activity levels in the Bakken.
Water Services. Revenue decreased $115.1 million, or 12.8%, to $786.5 million for the year ended December 31, 2025, compared to $901.7 million for the year ended December 31, 2024. The decrease was primarily driven by lower Fluids Hauling revenue following the divestiture of operations in connection with the Omni transaction, as well as lower Water Sourcing revenue associated with the transition from certain freshwater to produced water operations. Broader macroeconomic softness also contributed to lower Water Transfer and Well Testing revenue. This was partially offset by higher Accommodation and Rentals revenue driven by increased power generation activity and underlying organic growth.
Chemical Technologies. Revenue increased $48.1 million, or 18.5%, to $307.6 million for the year ended December 31, 2025 compared to $259.5 million for the year ended December 31, 2024. The increase in revenues was primarily driven by continued success in new product development, which has supported market share gains across key customer segments, as well as improved sales team execution.
Costs of Revenue
Costs of revenue decreased $27.7 million, or 2.2%, to $1.205 billion for the year ended December 31, 2025, compared to $1.233 billion for the year ended December 31, 2024. The decrease was primarily composed of an $85.7 million decrease in Water Services costs partially offset by a $30.7 million increase in Chemical Technologies costs, a $6.4 million increase in Water Infrastructure costs and an increase of $21.0 million in depreciation, amortization and accretion. The costs of revenue changes by reportable segment are as follows:
Water Infrastructure. Costs of revenue increased $6.4 million, or 4.6%, to $143.9 million for the year ended December 31, 2025, compared to $137.6 million for the year ended December 31, 2024. Cost of revenue as a percent of revenue decreased to 46.0% from 47.3% primarily driven by higher margins in gathering, disposal, and solids operations, reflecting both the accretive impact of recently acquired assets and effective integration execution. Pipeline margins were also higher in the period. These increases were partially offset by modest declines in higher margin recycling operations, primarily reflecting changes in service mix, though recycling margins remained above 50% for the year despite the year-over-year decline.
Water Services. Costs of revenue decreased $85.7 million, or 11.9%, to $635.2 million for the year ended December 31, 2025, compared to $720.9 million for the year ended December 31, 2024. Cost of revenue as a percent of revenue increased to 80.8% from 80.0% primarily impacted by lower revenue levels in the Water Transfer, Well Testing business lines, as not all costs could be proportionally reduced. This increase was also impacted by a decline water sourcing revenue and margins, reflecting a transition of certain fresh water to produced water operations. Further, Accommodations and Rental’s margins declined due to customer and activity mix. This was partially offset by improved gross margins in our Fluids Hauling business line, favorably impacted by the divestment of lower margin operations in connection with the Omni transaction.
Chemical Technologies. Costs of revenue increased $30.7 million, or 13.9%, to $251.3 million for the year ended December 31, 2025, compared to $220.6 million for the year ended December 31, 2024. Cost of revenue as a
72
percent of revenue decreased to 81.7% from 85.0% primarily attributable to a higher proportion of sales from higher margin products, coupled with reduced freight costs resulting from a shift from third-party providers to internal logistics execution.
Depreciation amortization and accretion. Depreciation, amortization and accretion expense increased $21.0 million, or 13.6%, to $174.5 million for the year ended December 31, 2025, compared to $153.5 million for the year ended December 31, 2024 primarily due to a higher fixed asset base resulting from investments made into new organic infrastructure projects as well as recent acquisitions. Also contributing to the increase was higher accretion expense resulting from a change in estimated plug and abandonment costs on previously acquired inactive SWDs.
Gross Profit
Gross profit was $202.4 million for the year ended December 31, 2025 compared to $219.5 million for the year ended December 31, 2024. The decrease was primarily driven by a $29.5 million decrease in gross profit from our Water Services segment and a $21.0 million increase in depreciation, amortization and accretion expense partially offset by a $17.4 million increase in our Chemical Technologies segment and a $16.0 million increase in gross profit from our Water Infrastructure segment. Gross margin as a percentage of revenue was 14.4% and 15.1% during the years ended December 31, 2025 and December 31, 2024, respectively.
Selling, General and Administrative Expenses
Selling, general and administrative expenses increased $1.3 million, or 0.8%, to $161.3 million for the year ended December 31, 2025, compared to $160.0 million for the year ended December 31, 2024. The increase was primarily driven by $5.4 million in higher information technology costs, a $5.4 million increase in wages and associated taxes and benefits and contract labor, $0.9 million higher bad debt expense and $0.8 million in higher severance expense partially offset by a $6.6 million decline in incentive and equity-based compensation, $2.9 million in lower transaction and rebranding costs, and a $1.7 million reduction in legal and professional fees and other expenses.
Gain on Sales of Property and Equipment and Divestitures, Net
During the year ended December 31, 2025, we recognized $10.3 million in gains on sales of property and equipment and divestitures, primarily consisting of $6.4 million in underutilized or obsolete property and equipment in our Water Services segment, $2.9 million in our Water Infrastructure segment comprised of a $4.7 million gain from the sale of excess land in the Haynesville/East Texas region partially offset by $1.8 million of losses on sales of obsolete and underutilized property and equipment, and $1.0 million of obsolete property and equipment in our Chemical Technologies segment. During the year ended December 31, 2024, amounts recognized were due primarily to sales of underutilized or obsolete property and equipment.
Impairments and Abandonments
For the year ended December 31, 2025, we recognized $6.2 million in impairments and abandonments, consisting of $4.4 million in the Water Infrastructure segment primarily associated with SWD abandonments and the termination of a disposal lease, $1.2 million in Other related to abandonment of back-office software development costs previously classified as Other long-term assets and $0.6 million in the Water Services segment related to the relocation of operations from a leased facility. For the year ended December 31, 2024, we recorded $1.2 million of abandonment that was primarily attributable to abandoned property and equipment.
Net Interest Expense
Net interest expense increased by $16.2 million, or 232.8%, to $23.2 million for the year ended December 31, 2025, compared to $7.0 million for the year ended December 31, 2024 due to interest expense on the new Term Loan Facility as well as higher amortization of deferred debt issuance costs in connection with our new Sustainability-Linked Credit Facility and extinguishment costs related to our Prior Sustainability-Linked Credit Facility.
73
Remeasurement Gain on Business Combination
For the year ended December 31, 2025, a remeasurement gain of $14.9 million was recognized in connection with Water Services property and equipment that was part of the purchase consideration transferred to Omni.
Tax Receivable Agreements Expense
As of December 31, 2025 and 2024, we determined that we were in a position to reasonably estimate the amount of the liability associated with the TRAs and determined that future payments under the terms of the TRAs were probable, and therefore recorded expense of $5.0 million and $0.8 million for the years ended December 31, 2025 and 2024, respectively.
Income Tax Benefit (Expense)
For the years ended December 31, 2025 and December 31, 2024, we recorded $1.6 million in income tax benefit and $13.6 million in income tax expense, respectively. The current year $1.6 million benefit was primarily driven by a favorable adjustment to the valuation allowance, as well as research and development and energy investment tax credits.
Net Income
Net Income decreased by $14.0 million, to a net income of $21.5 million for the year ended December 31, 2025 compared to $35.5 million for the year ended December 31, 2024, driven primarily by lower gross profit, an increase in interest expense, equity investment losses and tax receivable agreements expense during 2025 partially offset by 2025 income tax benefit compared to 2024 income tax expense, the remeasurement gain on business combination and increased gains on sales of property and equipment and divestitures, net.
Comparison of Non-GAAP Financial Measures
Our board of directors, management and investors use EBITDA and Adjusted EBITDA to assess our financial performance because it allows them to compare our operating performance on a consistent basis across periods by removing the effects of our capital structure (such as varying levels of interest expense), asset base (such as depreciation, amortization and accretion) and items outside the control of our management team. We present EBITDA and Adjusted EBITDA because we believe they provide useful information regarding the factors and trends affecting our business in addition to measures calculated under GAAP.
Note Regarding Non-GAAP Financial Measures
EBITDA and Adjusted EBITDA
EBITDA and Adjusted EBITDA are not financial measures presented in accordance with GAAP. We believe that the presentation of these non-GAAP financial measures will provide useful information to investors in assessing our financial performance and results of operations. Net income is the GAAP measure most directly comparable to EBITDA and Adjusted EBITDA. Our non-GAAP financial measures should not be considered as alternatives to the most directly comparable GAAP financial measure. Each of these non-GAAP financial measures has important limitations as an analytical tool due to the exclusion of some but not all items that affect the most directly comparable GAAP financial measures. One should not consider EBITDA or Adjusted EBITDA in isolation or as substitutes for an analysis of our results as reported under GAAP. Because EBITDA and Adjusted EBITDA may be defined differently by other companies in our industry, our definitions of these non-GAAP financial measures may not be comparable to similarly titled measures of other companies, thereby diminishing their utility.
74
The following table sets forth our reconciliation of EBITDA and Adjusted EBITDA to our net income, which is the most directly comparable GAAP measure, for the years ended December 31, 2025 and 2024.
Year Ended December 31, | ||||||
2025 | | 2024 | ||||
(in thousands) | ||||||
Net income | $ | 21,467 | $ | 35,450 | ||
Interest expense, net | 23,181 | 6,965 | ||||
Income tax (benefit) expense | (1,608) | 13,568 | ||||
Depreciation, amortization and accretion | 179,818 | 156,947 | ||||
EBITDA | 222,858 | 212,930 | ||||
Tax receivable agreements expense | 4,995 | 836 | ||||
Non-cash compensation expenses | 19,875 | 26,358 | ||||
Non-recurring severance expenses(1) | 1,467 | 648 | ||||
Non-cash loss on sale of assets or subsidiaries | 1,399 | 3,609 | ||||
Transaction and rebranding costs | 10,269 | 10,038 | ||||
Lease abandonment costs | 734 | 358 | ||||
Impairments and abandonments | 6,221 | 1,237 | ||||
Remeasurement gain on business combination | (14,924) | — | ||||
Equity in losses of unconsolidated entities | 4,892 | 352 | ||||
Other | 2,497 | 2,029 | ||||
Adjusted EBITDA | $ | 260,283 | $ | 258,395 | ||
| (1) | For the year ended December 31, 2025, these costs relate to severance expense in connection with the termination of certain former management employees related to a reorganization. For the year ended December 31, 2024, these costs related to severance costs associated with our former chief financial officer (“CFO”). |
EBITDA was $222.9 million for the year ended December 31, 2025 compared to $212.9 million for the year ended December 31, 2024. The $10.0 million increase in EBITDA was driven primarily by a $14.9 million remeasurement gain on business combination with Omni, a $7.1 million increase in gains on asset sales and $3.9 million in higher gross profit partially offset by a $5.0 million increase in impairments and abandonments, $4.5 million less in equity earnings in unconsolidated investments, $4.2 million increase in tax receivable agreements expense and a $1.3 million increase in selling, general and administrative expenses. Adjusted EBITDA was $260.3 million for the year ended December 31, 2025 compared to $258.4 million for the year ended December 31, 2024.
Liquidity and Capital Resources
Overview
Our primary sources of liquidity are cash on hand, borrowing capacity under the Sustainability-Linked Credit Facility, cash flows from operations and proceeds from the sale of excess property and equipment. Our primary uses of capital have been to fund current operations, maintain our asset base, implement technological advancements, make capital expenditures to support organic growth, fund acquisitions and equity investments, pay dividends and distributions, make payments under the TRAs, and when appropriate, repurchase shares of Class A common stock in the open market. Depending on available opportunities, market conditions and other factors, we may also issue debt and equity securities, in the future, if needed.
We prioritize sustained positive FCF and a strong balance sheet, and evaluate potential acquisitions and investments in the context of those priorities, in addition to the economics of the opportunity. We believe this approach provides us with additional flexibility to evaluate larger investments as well as improved resilience in a sustained downturn versus many of our peers.
Based on our current cash and cash equivalents balance, operating cash flow, available borrowings under our Sustainability-Linked Credit Facility and the ongoing actions discussed above, we believe that we will be able to
75
maintain sufficient liquidity to satisfy our obligations and remain in compliance with our existing debt covenants through the next twelve months and beyond, prior to giving effect to any future financing that may occur.
We intend to finance most of our capital expenditures, contractual obligations and working capital needs with cash on hand, cash generated from operations and borrowings under our Sustainability-Linked Credit Facility. For a discussion of the Sustainability-Linked Credit Facility, see “—Sustainability-Linked Credit Facility” below. Although we cannot provide any assurance, we believe that our current cash balance, operating cash flow and available borrowings under our Sustainability-Linked Credit Facility will be sufficient to fund our operations for at least the next twelve months. In addition, we may opportunistically seek to raise additional capital through securities offerings or other avenues, as appropriate, based on market circumstances and other factors.
During the fourth quarter of 2022, we initiated a quarterly dividend and distribution program of $0.05 per share and $0.05 per unit for holders of Class A and Class B shares, respectively. We paid quarterly dividends at the same rate through the third quarter of 2023, then the board of directors increased the quarterly dividend paid on November 17, 2023 to $0.06 per share and $0.06 per unit for holders of Class A and Class B shares, respectively. We paid quarterly dividends at the same rate through the third quarter of 2024, then the board of directors increased the quarterly dividend paid on November 15, 2024 to $0.07 per share and $0.07 per unit for holders of Class A and Class B shares, respectively. This program resulted in a financing outflow of $33.7 million and $29.7 million during the years ended December 31, 2025 and 2024, respectively. This quarterly dividend program is expected to continue into 2026 and beyond. All future dividend payments are subject to quarterly review and approval by our board of directors.
As of December 31, 2025, cash and cash equivalents totaled $18.1 million and we had approximately $145.5 million of available borrowing capacity under the Revolving Credit Facility under our Sustainability-Linked Credit Facility. As of December 31, 2025, we had $320.0 million in outstanding indebtedness, the borrowing base for the Revolving Credit Facility under the Sustainability-Linked Credit Facility was $235.1 million, the borrowing base for the Term Loan Facility under the Sustainability-Linked Credit Facility was $426.3 million and outstanding letters of credit totaled $19.6 million. As of February 16, 2026, we had $363.5 million in outstanding indebtedness, the borrowing base for the Revolving Credit Facility under the Sustainability-Linked Credit Facility was $214.5 million, the borrowing base for the Term Loan under the Sustainability-Linked Credit Facility was $426.3 million, the outstanding letters of credit totaled $19.6 million, and the available borrowing capacity under the Sustainability-Linked Credit Facility was $81.4 million.
As of December 31, 2025, we had no material off-balance sheet arrangements. As such, we are not exposed to any material financing, liquidity, market or credit risk that could arise if we had engaged in such financing arrangements.
Our contractual obligations include, among other things, our Sustainability-Linked Credit Facility and operating leases. Refer to “Note 6—Leases” for operating lease obligations as of December 31, 2025 and “Note 10—Debt” for an update to our Sustainability-Linked Credit Facility as of December 31, 2025.
76
Cash Flows
The following table summarizes our cash flows for the years ended December 31, 2025 and 2024. The summary of our cash flows for the years ended December 31, 2024 and 2023 is set forth in Part II, Item 7 of our Annual Report on Form 10-K for the fiscal year ended December 31, 2024 under the caption “Management’s Discussion and Analysis of Financial Condition and Results of Operations.”
Cash Flow Changes Between the Years Ended December 31, 2025 and 2024
Year Ended December 31, | Dollar Change | Percentage Change | ||||||||||
2025 | | 2024 | | |||||||||
(in thousands) | ||||||||||||
Net cash provided by operating activities | $ | 214,673 | $ | 234,886 | $ | (20,213) | (8.6) | % | ||||
Net cash used in investing activities | (404,962) | (318,623) | (86,339) | (27.1) | % | |||||||
Net cash provided by financing activities | 188,389 | 46,641 | 141,748 | 303.9 | % | |||||||
Subtotal | $ | (1,900) | $ | (37,096) | ||||||||
Effect of exchange rate changes on cash and cash equivalents | 6 | (9) | 15 | NM | ||||||||
Net decrease in cash and cash equivalents | $ | (1,894) | $ | (37,105) | ||||||||
Operating Activities. Net cash provided by operating activities was $214.7 million for the year ended December 31, 2025, compared to $234.9 million for the year ended December 31, 2024. The $20.2 million decrease is comprised of $14.9 million of net income combined with non-cash adjustments and a $5.3 million decrease in converting working capital to cash.
Investing Activities. Net cash used in investing activities was $405.0 million for the year ended December 31, 2025, compared to $318.6 million for the year ended December 31, 2024. The $86.3 million increase in net cash used in investing activities was due primarily to a $121.4 million increase in purchases of property and equipment, a $72.1 million investment in unconsolidated entities during the year ended December 31, 2025 and $0.6 million in lower proceeds received from sales of property and equipment partially offset by a $107.7 million decrease in spending for acquisitions net of cash received.
Financing Activities. Net cash provided by financing activities was $188.4 million for the year ended December 31, 2025, compared to $46.6 million for the year ended December 31, 2024. The $141.7 million increase in net cash provided by financing activities was due primarily to a $150.0 million increase in borrowings net of repayments and $2.9 million of cash received from noncontrolling interest holders during the year ended December 31, 2025 partially offset by $7.9 million of debt issuance costs during the year ended December 31, 2025 and a $3.9 million increase in dividends and distributions paid.
Free Cash Flow
The following table summarizes our FCF for the periods indicated:
Year ended December 31, | ||||||
| 2025 | | 2024 | |||
(in thousands) | ||||||
Net cash provided by operating activities | $ | 214,673 | $ | 234,886 | ||
Purchase of property and equipment | (294,562) | (173,153) | ||||
Proceeds received from sale of property and equipment | 15,251 | 15,809 | ||||
Free cash flow | $ | (64,638) | $ | 77,542 | ||
77
Sustainability-Linked Credit Facility
On January 24, 2025 (the “Closing Date”), SES Holdings, a subsidiary of the Company, Select Water Solutions, LLC, a subsidiary of SES Holdings (the “Select LLC”), Bank of America, N.A., as administrative agent, issuing lender and swingline lender (the “Administrative Agent”), and the other lenders party thereto, entered into that certain sustainability-linked senior secured credit facility (the “Sustainability-Linked Credit Facility”), which initially provides for $300.0 million in revolving commitments (the “Revolving Credit Facility”) and $250.0 million in term commitments (the “Term Loan Facility”), in each case, subject to a borrowing base. The Sustainability-Linked Credit Facility also has a sublimit of $50.0 million for letters of credit and a sublimit of $30.0 million for swingline loans. Subject to obtaining commitments from existing or new lenders, Select LLC has the option to increase the maximum amount under the sustainability-linked senior secured credit facility by (i) $150.0 million for additional revolving commitments and (ii) $50.0 million for additional term commitments, in each case, during the first four years following the Closing Date. As of the Closing Date, (i) there were no borrowings outstanding under the Revolving Credit Facility and approximately $20.0 million of letters of credit issued and outstanding thereunder and (ii) the Term Loan Facility was fully funded. Capitalized terms used but not defined herein have the meaning ascribed to them in the Sustainability-Linked Credit Facility.
Refer to “Note 10—Debt” for further discussion of the Sustainability-Linked Credit Facility.
Critical Accounting Policies and Estimates
The preparation of consolidated financial statements in conformity with GAAP requires management to make estimates and assumptions that affect the reported amounts of assets and liabilities and disclosures about any contingent assets and liabilities at the date of the financial statements and the reported amounts of revenues and expenses during the reporting period. Actual results could differ from those estimates. Our critical accounting policies are described below to provide a better understanding of how we develop our assumptions and judgments about future events and related estimations and how they can impact our financial statements. The following accounting policies involve critical accounting estimates because they are dependent on our judgment and assumptions about matters that are inherently uncertain.
We base our estimates on historical experience and on various other assumptions we believe to be reasonable according to the current facts and circumstances, the results of which form the basis for making judgments about the carrying values of assets and liabilities that are not readily apparent from other sources. Estimates and assumptions about future events and their effects are subject to uncertainty and, accordingly, these estimates may change as new events occur, as more experience is acquired, as additional information is obtained, and as the business environment in which we operate changes. We believe the current assumptions, judgments and estimates used to determine amounts reflected in our consolidated financial statements are appropriate, however, actual results may differ under different conditions. This discussion and analysis should be read in conjunction with our consolidated financial statements and related notes included in this Annual Report.
Goodwill and other intangible assets: The purchase price of acquired businesses is allocated to its identifiable assets and liabilities based upon estimated fair values as of the acquisition date. Goodwill and other intangible assets are initially recorded at their fair values. Goodwill represents the excess of the purchase price of acquisitions over the fair value of the net assets acquired in a business combination. Goodwill and other intangible assets not subject to amortization are tested for impairment annually or more frequently if events or changes in circumstances indicate that the asset might be impaired. Intangible assets with finite useful lives are amortized either on a straight-line basis over the asset’s estimated useful life or on a basis that reflects the pattern in which the economic benefits of the intangible assets are realized.
Impairment of goodwill, long-lived assets and intangible assets: Long-lived assets, such as property and equipment and finite-lived intangible assets, are evaluated for impairment whenever events or changes in circumstances indicate that their carrying value may not be recoverable. Recoverability is measured by a comparison of their carrying amount to the estimated undiscounted cash flows to be generated by those assets. If the undiscounted cash flows are less than the carrying amount, we record impairment losses for the excess of their carrying value over the estimated fair
78
value. Fair value is determined, in part, by the estimated cash flows to be generated by those assets. Our cash flow estimates are based upon, among other things, historical results adjusted to reflect our best estimate of future market rates, utilization levels, and operating performance. Development of future cash flows also requires management to make assumptions and to apply judgment, including the timing of future expected cash flows, using the appropriate discount rates and determining salvage values. The estimate of fair value represents our best estimates of these factors based on current industry trends and reference to market transactions and is subject to variability. Assets are generally grouped at the lowest level of identifiable cash flows. We operate within the oilfield service industry, and the cyclical nature of the oil and gas industry that we serve and our estimates of the period over which future cash flows will be generated, as well as the predictability of these cash flows, can have a significant impact on the estimated fair value of these assets and, in periods of prolonged down cycles, may result in impairment charges. Changes to our key assumptions related to future performance, market conditions and other economic factors could adversely affect our impairment valuation.
We conduct our annual goodwill impairment tests in the fourth quarter of each year, and whenever impairment indicators arise, by examining relevant events and circumstances which could have a negative impact on its goodwill such as macroeconomic conditions, industry and market conditions, cost factors that have a negative effect on earnings and cash flows, overall financial performance, acquisitions and divestitures and other relevant entity-specific events. If a qualitative assessment indicates that it is more likely than not that the fair value of a reporting unit is less than its carrying amount, we are required to perform a quantitative impairment test for goodwill comparing the reporting unit’s carrying value to its fair value. Our reporting units are based on our organizational and reporting structure. In determining fair values for the reporting units, we rely primarily on the income and market approaches for valuation. In the income approach, we discount predicted future cash flows using a weighted-average cost of capital calculation based on publicly-traded peer companies. In the market approach, valuation multiples are developed from both publicly-traded peer companies as well as other company transactions.
If the fair value of a reporting unit is less than its carrying value, goodwill impairment is calculated by subtracting the fair value of the reporting unit from the carrying value. Application of the goodwill impairment test requires judgment, including the identification of reporting units, allocation of assets (including goodwill) and liabilities to reporting units and determining the fair value. The determination of reporting unit fair value relies upon certain estimates and assumptions that are complex and are affected by numerous factors, including the general economic environment and levels of E&P activity of oil and gas companies, our financial performance and trends and our strategies and business plans, among others. Unanticipated changes, including immaterial revisions, to these assumptions, could result in a provision for impairment in a future period. Given the nature of these evaluations and their application to specific assets and time frames, it is not possible to reasonably quantify the impact of changes in these assumptions.
Retentions: We assume risk of loss through deductibles and self-insured retentions, up to certain levels for losses related to general liability, workers’ compensation and employer’s liability, vehicle liability, and health insurance. Our exposure (i.e., the self-insured retention or deductible) per occurrence is $1.0 million for general liability, $1.0 million for workers’ compensation and employer’s liability, $2.0 million for auto liability and $0.4 million for health insurance. We also have an excess loss policy over these coverages with a limit of $100.0 million in the aggregate. Management reviews its estimates of reported and unreported claims and provides for losses through reserves. We use actuarial estimates to record our liability for future periods. If the number of claims or the costs associated with those claims were to increase significantly over our estimates, additional charges to earnings could be necessary to cover required payments. As of December 31, 2025, we estimate the range of exposure to be from $18.1 million to $22.4 million and have recorded liabilities of $20.1 million, which represents management’s best estimate of probable loss related to workers’ compensation and employer’s liability, and auto liability. Additionally, as of December 31, 2025, accrued health insurance and accrued general liabilities were $3.9 million and $4.0 million, respectively.
Tax Receivable Agreements: We intend to fund any obligation under the TRAs with cash from operations or borrowings under our Sustainability-Linked Credit Facility. With respect to obligations under each of our TRAs (except in cases where we elect to terminate the TRAs early, the TRAs are terminated early due to certain mergers or other changes of control or we have available cash but fail to make payments when due), generally we may elect to defer payments due under the TRAs if we do not have available cash to satisfy our payment obligations under the TRAs or if
79
our contractual obligations limit our ability to make these payments. Any such deferred payments under the TRAs generally will accrue interest.
We account for any amounts payable under the TRAs in accordance with Accounting Standards Codification (“ASC”) Topic 450, Contingencies. For a discussion regarding an acceleration of the amounts payable under the TRAs if we elect to terminate the TRAs early or they are terminated early due to our failure to honor a material obligation thereunder or due to certain mergers, asset sales, other forms of business combinations or other changes of control and the potential impact of such an acceleration and the potential impact of such acceleration, please read Part I, Item 1A. “Risk Factors – Risks Related to Our Organizational Structure. In certain cases, payments under the TRAs may be accelerated and/or significantly exceed the actual benefits, if any, we realize in respect of the tax attributes subject to the TRAs.
We have assessed the amount of any liability under the TRAs required under the provisions of ASC 450 in connection with preparing the consolidated financial statements. As of December 31, 2025 and 2024, we determined that we were in a position to reasonably estimate an amount of liability associated with the TRAs and determined that future payments under the terms of the TRAs were probable, and therefore recorded liabilities of $43.4 million and $38.5 million, respectively. The projection of future taxable income and utilization of tax value attributes associated with the TRAs involve estimates which require judgment. The amount of the Company’s actual taxable income, passage of future legislation, or consummation of significant transactions in the future may impact the liability related to the TRAs.
Realizability of Deferred Tax Assets: We establish valuation allowances when necessary to reduce deferred tax assets to the amounts more likely than not to be realized. Deferred income tax assets are evaluated quarterly to determine if valuation allowances are required or should be adjusted. The ability to realize deferred tax assets depends on the ability to generate sufficient taxable income within the carryback or carryforward periods provided for in the tax law for each applicable tax jurisdiction. The assessment regarding whether a valuation allowance is required or should be adjusted is based on an evaluation of possible sources of taxable income and also considers all available positive and negative evidence factors. Our accounting for the realization of deferred tax assets incorporates, amongst other factors, our best estimate of future events. Changes in our current estimates, due to unanticipated market conditions, governmental legislative actions or events, could have a material effect on our ability to utilize deferred tax assets. As of December 31, 2025, valuation allowances against deferred tax assets were $100.2 million. See “Note 15—Income Taxes” for additional information.
Recent Accounting Pronouncements
Refer to “Note 2—Significant Accounting Policies” for recent accounting pronouncements.
ITEM 7A. QUANTITATIVE AND QUALITATIVE DISCLOSURES ABOUT MARKET RISK
The demand, pricing and terms for oilfield services provided by us are largely dependent upon the level of drilling and completion activity in the U.S. oil and gas industry as well as the level of oil and gas production. The level of drilling and completion activity is influenced by numerous factors over which we have no control, including, but not limited to: the supply of and demand for oil and gas; war, armed conflicts, economic sanctions and other constraints to global trade and economic growth; current price levels as well as expectations about future prices of oil and gas, including announcements and actions taken by the members of OPEC+ with respect to oil production levels; such as announced production cuts and the willingness of member countries to follow such cuts; the magnitude and timing of capital spending by our customers; the cost of exploring for, developing, producing and delivering oil and gas; the extent to which our E&P customers choose to drill and complete new wells to offset decline from their existing wells; the extent to which our E&P customers choose to invest to grow production; discoveries of new oil and gas reserves; available storage capacity and pipeline and other transportation capacity; weather conditions; domestic and worldwide economic conditions; instability in oil-producing countries; environmental regulations; technical advances in alternative forms of energy (e.g., wind and solar electricity, electric vehicles) that encourage substitution for or displacement of oil and gas consumption in end-use markets; the price and availability of alternative fuels; the ability of oil and gas producers to raise equity capital and debt financing; changes in global trade policy, including the imposition of tariffs; global health events; merger and acquisition activity and consolidation in our industry, and other factors.
80
Any combination of these factors that results in sustained low oil and gas prices and, therefore, lower capital spending and / or reduced drilling and completion activity by our customers, would likely have a material adverse effect on our business, financial condition, results of operations and cash flows.
Interest Rate Risk
As of December 31, 2025, we had $320.0 million in outstanding borrowings and $145.5 million of available borrowing capacity under our Sustainability-Linked Credit Facility. As of February 16, 2026, we had $363.5 million in outstanding borrowings and $81.4 million of available borrowing capacity under our Sustainability-Linked Credit Facility. Interest is calculated under the terms of our Sustainability-Linked Credit Facility based on our selection, from time to time, of one of the index rates available to us plus an applicable margin that varies based on certain factors. A hypothetical one percentage point increase in interest rates on our borrowings outstanding under our Sustainability-Linked Credit Facility as of December 31, 2025 would increase our annual interest expense by approximately $3.2 million. We do not currently have or intend to enter into any derivative arrangements to protect against fluctuations in interest rates applicable to our outstanding indebtedness.
ITEM 8. FINANCIAL STATEMENTS AND SUPPLEMENTARY DATA
The report of our independent registered public accounting firm and our consolidated financial statements and supplementary data are included in this Annual Report beginning on page F-1.
ITEM 9. CHANGES IN AND DISAGREEMENTS WITH ACCOUNTANTS ON ACCOUNTING AND FINANCIAL DISCLOSURE
None.
ITEM 9A. CONTROLS AND PROCEDURES
Disclosure Controls and Procedures
We maintain disclosure controls and procedures that are designed to provide reasonable assurance that information required to be disclosed by us in reports that we file or submit under the Exchange Act is recorded, processed, summarized and reported within the time periods specified in the SEC's rules and forms, and that such information is accumulated and communicated to our management, including our CEO (principal executive officer) and CFO (principal financial officer), as appropriate, to allow for timely decisions regarding required disclosure. In designing and evaluating the disclosure controls and procedures, management recognizes that any controls and procedures, no matter how well-designed and operated, can provide only reasonable assurance of achieving the desired control objectives, and management is required to apply its judgment in evaluating the cost-benefit relationship of possible controls and procedures.
As required by SEC Rule 13a-15(b), we carried out an evaluation, under the supervision and with the participation of our management, including our CEO and CFO, of the effectiveness of our disclosure controls and procedures as of December 31, 2025. Based on their evaluation, the Company's CEO and CFO have concluded that the Company's disclosure controls and procedures were effective at a reasonable level of assurance as of December 31, 2025.
Management’s Annual Report on Internal Control over Financial Reporting
Our management is responsible for establishing and maintaining adequate internal control over financial reporting. Internal control over financial reporting is defined in Rule 13a-15(f) and 15d-15(f) promulgated under the Exchange Act as a process designed by, or under the supervision of, our principal executive and principal financial officers, or persons performing similar functions, and effected by our board of directors, management and other
81
personnel, to provide reasonable assurance regarding the reliability of financial reporting and the preparation of financial statements for external purposes in accordance with generally accepted accounting principles.
Because of its inherent limitations, internal control over financial reporting may not prevent or detect misstatements. Also, projections of any evaluation of effectiveness to future periods are subject to the risk that controls may become inadequate because of changes in conditions, or that the degree of compliance with the policies or procedures may deteriorate.
Under the supervision and with the participation of management, including the CEO and CFO, the Company conducted an evaluation of the effectiveness of the Company’s internal control over financial reporting based on the framework in “Internal Control – Integrated Framework (2013)” issued by the Committee of Sponsoring Organizations of the Treadway Commission (“COSO”). Based on this assessment, our management concluded that our internal control over financial reporting was effective as of December 31, 2025. Grant Thornton LLP, an independent registered public accounting firm, audited the effectiveness of our internal control over financial reporting as of December 31, 2025.
Changes in Internal Control Over Financial Reporting
There were no changes in our internal control over financial reporting (as defined in Exchange Act Rule 13a-15(f)) during the quarter ended December 31, 2025 which materially affected, or are reasonably likely to materially affect, our internal control over financial reporting.
82
REPORT OF INDEPENDENT REGISTERED PUBLIC ACCOUNTING FIRM
Board of Directors and Stockholders
Select Water Solutions, Inc.
Opinion on internal control over financial reporting
We have audited the internal control over financial reporting of Select Water Solutions, Inc. (a Delaware corporation) and subsidiaries (the “Company”) as of December 31, 2025, based on criteria established in the 2013 Internal Control—Integrated Framework issued by the Committee of Sponsoring Organizations of the Treadway Commission (“COSO”). In our opinion, the Company maintained, in all material respects, effective internal control over financial reporting as of December 31, 2025, based on criteria established in the 2013 Internal Control—Integrated Framework issued by COSO.
We also have audited, in accordance with the standards of the Public Company Accounting Oversight Board (United States) (“PCAOB”), the consolidated financial statements of the Company as of and for the year ended December 31, 2025, and our report dated February 18, 2026 expressed an unqualified opinion on those financial statements.
Basis for opinion
The Company’s management is responsible for maintaining effective internal control over financial reporting and for its assessment of the effectiveness of internal control over financial reporting, included in the accompanying Management’s Annual Report on Internal Control over Financial Reporting. Our responsibility is to express an opinion on the Company’s internal control over financial reporting based on our audit. We are a public accounting firm registered with the PCAOB and are required to be independent with respect to the Company in accordance with the U.S. federal securities laws and the applicable rules and regulations of the Securities and Exchange Commission and the PCAOB.
We conducted our audit in accordance with the standards of the PCAOB. Those standards require that we plan and perform the audit to obtain reasonable assurance about whether effective internal control over financial reporting was maintained in all material respects. Our audit included obtaining an understanding of internal control over financial reporting, assessing the risk that a material weakness exists, testing and evaluating the design and operating effectiveness of internal control based on the assessed risk, and performing such other procedures as we considered necessary in the circumstances. We believe that our audit provides a reasonable basis for our opinion.
Definition and limitations of internal control over financial reporting
A company’s internal control over financial reporting is a process designed to provide reasonable assurance regarding the reliability of financial reporting and the preparation of financial statements for external purposes in accordance with generally accepted accounting principles. A company’s internal control over financial reporting includes those policies and procedures that (1) pertain to the maintenance of records that, in reasonable detail, accurately and fairly reflect the transactions and dispositions of the assets of the company; (2) provide reasonable assurance that transactions are recorded as necessary to permit preparation of financial statements in accordance with generally accepted accounting principles, and that receipts and expenditures of the company are being made only in accordance with authorizations of management and directors of the company; and (3) provide reasonable assurance regarding prevention or timely detection of unauthorized acquisition, use, or disposition of the company’s assets that could have a material effect on the financial statements.
Because of its inherent limitations, internal control over financial reporting may not prevent or detect misstatements. Also, projections of any evaluation of effectiveness to future periods are subject to the risk that controls may become inadequate because of changes in conditions, or that the degree of compliance with the policies or procedures may deteriorate.
/s/ GRANT THORNTON LLP
Dallas, Texas
February 18, 2026
83
Item 9B. | Other Information |
Disclosure of 10b5-1 plans
During the three months ended December 31, 2025,
Item 9C. | Disclosure Regarding Foreign Jurisdictions that Prevent Inspections |
None.
PART III
ITEM 10.DIRECTORS, EXECUTIVE OFFICERS AND CORPORATE GOVERNANCE
Select Water Solutions, Inc. has
ITEM 11.EXECUTIVE COMPENSATION
The information required in response to this Item 11 will be set forth in our definitive proxy statement for the 2026 annual meeting of stockholders and is incorporated herein by reference.
ITEM 12. | SECURITY OWNERSHIP OF CERTAIN BENEFICIAL OWNERS AND MANAGEMENT AND RELATED STOCKHOLDER MATTERS |
The information required in response to this Item 12 will be set forth in our definitive proxy statement for the 2026 annual meeting of stockholders and is incorporated herein by reference.
ITEM 13. | CERTAIN RELATIONSHIPS AND RELATED TRANSACTIONS, AND DIRECTOR INDEPENDENCE |
The information required in response to this Item 13 will be set forth in our definitive proxy statement for the 2026 annual meeting of stockholders and is incorporated herein by reference.
ITEM 14.PRINCIPAL ACCOUNTING FEES AND SERVICES
The information required in response to this Item 14 will be set forth in our definitive proxy statement for the 2026 annual meeting of stockholders and is incorporated herein by reference.
84
PART IV
ITEM 15.EXHIBIT AND FINANCIAL STATEMENT SCHEDULES
(a)(1) and (a)(2) Financial Statements and Financial Statement Schedules
Our consolidated financial statements are incorporated under Part II, Item 8. “Financial Statements and Supplementary Data” of this Annual Report. For a listing of these statements and accompanying notes, see “Index to Financial Statements” on Page F-1 of this Annual Report.
(a)(3) Exhibits
The exhibits required to be filed or furnished under Item 15 of this Annual Report are set forth below in the Exhibit Index included within this Annual Report.
EXHIBIT INDEX
Exhibit Number | | Description |
3.1 | ||
3.2 | ||
4.1 | ||
4.2 | ||
4.3 | ||
10.1 | ||
10.2 | ||
10.3 | ||
85
†10.4 | ||
†10.5 | ||
†10.6 | ||
†10.7 | ||
10.8 | ||
10.9 | ||
10.10 | ||
10.11 | ||
10.12 | ||
10.13 | ||
†10.14 | ||
†10.15 | ||
†10.16 | ||
86
†10.17 | ||
†10.18 | ||
†10.19 | ||
†10.20 | ||
†10.21 | ||
†10.22 | Form of Performance Share Unit Grant Notice and Performance Share Unit Agreement – Return on herein to Exhibit 10.5 to Select Energy Services, Inc.’s Quarterly Report on Form 10-Q, filed May 5, | |
†10.23 | ||
†10.24 | ||
†10.25 | ||
10.26 | ||
10.27 | ||
†10.28 | ||
†10.29 | ||
87
†10.30 | ||
*†10.31 | ||
*19.1 | ||
*21.1 | ||
*23.1 | ||
*31.1 | Certification of the Chief Executive Officer Pursuant to Rule 13a-14(a)/15d-14(a). | |
*31.2 | Certification of the Chief Financial Officer Pursuant to Rule 13a-14(a)/15d-14(a). | |
*32.1 | ||
*32.2 | ||
97.1 | ||
*101 | Interactive Data Files | |
*101.INS | iXBRL Instance Document. | |
*101.SCH | iXBRL Taxonomy Extension Schema Document. | |
*101.CAL | iXBRL Taxonomy Extension Calculation Linkbase Document. | |
*101.DEF | iXBRL Taxonomy Extension Definition Linkbase Document. | |
*101.LAB | iXBRL Taxonomy Extension Label Linkbase Document. | |
*101.PRE | iXBRL Taxonomy Extension Presentation Linkbase Document. | |
*101 | The following materials from Select Water Solutions, Inc.’s Annual Report on Form 10-K for the year ended December 31, 2025 formatted in iXBRL (Inline eXtensible Business Reporting Language): (i) Consolidated Balance Sheets; (ii) Consolidated Statements of Operations; (iii) Consolidated Statements of Comprehensive Income (Loss); (iv) Consolidated Statements of Changes in Equity; (v) Consolidated Statements of Cash Flows; and (vi) Notes to Consolidated Financial Statements. | |
104 | 104 Cover Page Interactive Data File (formatted as inline XBRL and contained in Exhibit 101). |
* | Filed or furnished with this Annual Report on Form 10-K. |
† | Management contract or compensatory plan or arrangement. |
ITEM 16. FORM 10-K SUMMARY.
None.
88
SIGNATURES
Pursuant to the requirements of Section 13 or 15(d) of the Securities Exchange Act of 1934, the Company has duly caused this report to be signed on its behalf by the undersigned, thereunto duly authorized.
Select Water Solutions, Inc. | |
Dated: February 18, 2026 | /s/ JOHN D. SCHMITZ |
John D. Schmitz | |
Chairman, President and Chief Executive Officer | |
Pursuant to the requirements of the Securities Exchange Act of 1934, this report has been signed below by the following persons on behalf of the Company and in the capacities indicated on February 18, 2026.
/s/ JOHN D. SCHMITZ | Chairman, President and Chief Executive Officer | |
John D. Schmitz | (Principal Executive Officer) | |
/s/ CHRIS GEORGE | Chief Financial Officer and Executive Vice President | |
Chris George | (Principal Financial Officer) | |
/s/ BRIAN P. SZYMANSKI | Chief Accounting Officer | |
Brian P. Szymanski | (Principal Accounting Officer) | |
/s/ ROBIN FIELDER | Director | |
Robin Fielder | ||
/s/ DOUGLAS J. WALL | Director | |
Douglas J. Wall | ||
/s/ RICHARD A. BURNETT | Director | |
Richard A. Burnett | ||
/s/ GAYLE BURLESON | Director | |
Gayle Burleson | ||
/s/ LUIS FERNANDEZ-MORENO | Director | |
Luis Fernandez-Moreno |
/s/ TIMOTHY A. ROBERTS | Director | |
Timothy A. Roberts |
/s/ BRUCE E. COPE | Director | |
Bruce E. Cope |
89
INDEX TO FINANCIAL STATEMENTS
SELECT WATER SOLUTIONS, INC.
F-1
REPORT OF INDEPENDENT REGISTERED PUBLIC ACCOUNTING FIRM
Board of Directors and Stockholders
Select Water Solutions, Inc.
Opinion on the financial statements
We have audited the accompanying consolidated balance sheets of Select Water Solutions, Inc. (a Delaware corporation) and subsidiaries (the “Company”) as of December 31, 2025 and 2024, the related consolidated statements of operations, comprehensive income, changes in equity, and cash flows for each of the three years in the period ended December 31, 2025, and the related notes (collectively referred to as the “consolidated financial statements”). In our opinion, the consolidated financial statements present fairly, in all material respects, the financial position of the Company as of December 31, 2025 and 2024, and the results of its operations and its cash flows for each of the three years in the period ended December 31, 2025, in conformity with accounting principles generally accepted in the United States of America.
We also have audited, in accordance with the standards of the Public Company Accounting Oversight Board (United States) (“PCAOB”), the Company’s internal control over financial reporting as of December 31, 2025, based on criteria established in the 2013 Internal Control—Integrated Framework issued by the Committee of Sponsoring Organizations of the Treadway Commission (“COSO”), and our report dated February 18, 2026 expressed an unqualified opinion.
Basis for opinion
These consolidated financial statements are the responsibility of the Company’s management. Our responsibility is to express an opinion on the Company’s consolidated financial statements based on our audits. We are a public accounting firm registered with the PCAOB and are required to be independent with respect to the Company in accordance with the U.S. federal securities laws and the applicable rules and regulations of the Securities and Exchange Commission and the PCAOB.
We conducted our audits in accordance with the standards of the PCAOB. Those standards require that we plan and perform the audit to obtain reasonable assurance about whether the financial statements are free of material misstatement, whether due to error or fraud. Our audits included performing procedures to assess the risks of material misstatement of the financial statements, whether due to error or fraud, and performing procedures that respond to those risks. Such procedures included examining, on a test basis, evidence regarding the amounts and disclosures in the financial statements. Our audits also included evaluating the accounting principles used and significant estimates made by management, as well as evaluating the overall presentation of the financial statements. We believe that our audits provide a reasonable basis for our opinion.
Critical audit matters
Critical audit matters are matters arising from the current period audit of the financial statements that were communicated or required to be communicated to the audit committee and that: (1) relate to accounts or disclosures that are material to the financial statements and (2) involved our especially challenging, subjective, or complex judgments. We determined that there are no critical audit matters.
/s/
We have served as the Company’s auditor since 2016.
February 18, 2026
F-2
SELECT WATER SOLUTIONS, INC.
CONSOLIDATED BALANCE SHEETS
(in thousands, except share data)
As of December 31, | ||||||
2025 | | 2024 | ||||
Assets | ||||||
Current assets | |
| | |||
Cash and cash equivalents | $ | | $ | | ||
Accounts receivable trade, net of allowance for credit losses of $ |
| |
| | ||
Accounts receivable, related parties |
| |
| | ||
Inventories |
| |
| | ||
Prepaid expenses and other current assets |
| |
| | ||
Total current assets |
| |
| | ||
Property and equipment |
| |
| | ||
Accumulated depreciation |
| ( |
| ( | ||
Total property and equipment, net |
| |
| | ||
Right-of-use assets, net | | | ||||
Goodwill |
| |
| | ||
Other intangible assets, net |
| |
| | ||
Deferred tax assets, net |
| |
| | ||
Investments in unconsolidated entities | | | ||||
Other long-term assets |
| |
| | ||
Total assets | $ | | $ | | ||
Liabilities and Equity |
|
| | |||
Current liabilities |
|
| | |||
Accounts payable | $ | | $ | | ||
Accrued accounts payable | | | ||||
Accounts payable and accrued expenses, related parties |
| |
| | ||
Accrued salaries and benefits |
| |
| | ||
Accrued insurance |
| |
| | ||
Sales tax payable | | | ||||
Current portion of tax receivable agreements liabilities | — | | ||||
Accrued expenses and other current liabilities |
| |
| | ||
Current operating lease liabilities | | | ||||
Current portion of long-term debt | | — | ||||
Current portion of finance lease obligations |
| |
| | ||
Total current liabilities |
| |
| | ||
Long-term tax receivable agreements liabilities |
| |
| | ||
Long-term operating lease liabilities |
| |
| | ||
Long-term debt, net |
| |
| | ||
Other long-term liabilities |
| |
| | ||
Total liabilities |
| |
| | ||
Commitments and contingencies (Note 11) |
|
| | |||
Class A common stock, $ |
| | | |||
Class B common stock, $ |
| |
| | ||
Preferred stock, $ |
|
| ||||
Additional paid-in capital |
| |
| | ||
Accumulated deficit |
| ( |
| ( | ||
Total stockholders’ equity |
| |
| | ||
Noncontrolling interests |
| |
| | ||
Total equity |
| |
| | ||
Total liabilities and equity | $ | | $ | | ||
The accompanying notes to consolidated financial statements are an integral part of these financial statements.
F-3
SELECT WATER SOLUTIONS, INC.
CONSOLIDATED STATEMENTS OF OPERATIONS
(in thousands, except share and per share data)
Year Ended December 31, | |||||||||
2025 | 2024 | 2023 | |||||||
Revenue | | | | ||||||
Water Infrastructure | $ | | $ | | $ | | |||
Water Services | | | | ||||||
Chemical Technologies |
| | | | |||||
Total revenue |
| |
| |
| | |||
Costs of revenue |
|
|
|
|
| | |||
Water Infrastructure | |
| |
| | ||||
Water Services | | | | ||||||
Chemical Technologies |
| |
| |
| | |||
Depreciation, amortization and accretion |
| |
| |
| | |||
Total costs of revenue |
| |
| |
| | |||
Gross profit |
| |
| |
| | |||
Operating expenses |
|
|
|
|
| | |||
Selling, general and administrative |
| |
| |
| | |||
Depreciation and amortization |
| |
| |
| | |||
Impairments and abandonments |
| |
| |
| | |||
Lease abandonment costs |
| |
| |
| | |||
Total operating expenses |
| |
| |
| | |||
Income from operations |
| |
| |
| | |||
Other income (expense) |
|
|
|
|
| | |||
Gain (loss) on sales of property and equipment and divestitures, net | | | ( | ||||||
Interest expense, net |
| ( |
| ( | ( | ||||
Remeasurement gain on business combination | |
| — | — | |||||
Tax receivable agreements expense | ( |
| ( | ( | |||||
Other |
| ( |
| ( | | ||||
Income before income tax benefit (expense) and equity in losses of unconsolidated entities |
| |
| |
| | |||
Income tax benefit (expense) |
| |
| ( |
| | |||
Equity in losses of unconsolidated entities | ( | ( | ( | ||||||
Net income |
| |
| |
| | |||
Less: net income attributable to noncontrolling interests |
| ( |
| ( |
| ( | |||
Net income attributable to Select Water Solutions, Inc. | $ | | $ | | $ | | |||
Net income per share attributable to common stockholders (Note 17): | |||||||||
Class A—Basic | $ | | $ | | $ | | |||
Class B—Basic | $ | — | $ | — | $ | — | |||
Net income per share attributable to common stockholders (Note 17): | |||||||||
Class A—Diluted | $ | | $ | | $ | | |||
Class B—Diluted | $ | — | $ | — | $ | — | |||
The accompanying notes to consolidated financial statements are an integral part of these financial statements.
F-4
SELECT WATER SOLUTIONS, INC.
CONSOLIDATED STATEMENTS OF COMPREHENSIVE INCOME
(in thousands)
Year Ended December 31, | |||||||||
2025 | 2024 | 2023 | |||||||
Net income | $ | | $ | | $ | | |||
Comprehensive income |
| |
| |
| | |||
Less: comprehensive income attributable to noncontrolling interests |
| ( |
| ( |
| ( | |||
Comprehensive income attributable to Select Water Solutions, Inc. | $ | | $ | | $ | | |||
The accompanying notes to consolidated financial statements are an integral part of these financial statements.
F-5
SELECT WATER SOLUTIONS, INC.
CONSOLIDATED STATEMENTS OF CHANGES IN EQUITY
(in thousands, except share data)
Class A | Class B | ||||||||||||||||||||||||
Stockholders | Stockholders | ||||||||||||||||||||||||
Class A | Class B | Additional | Total | ||||||||||||||||||||||
Common | Common | Paid-In | Accumulated | Stockholders’ | Noncontrolling | ||||||||||||||||||||
| Shares | | Stock | | Shares | | Stock | | Capital | | Deficit | | Equity | | Interests | | Total | ||||||||
Balance as of December 31, 2022 |
| | $ | |
| | $ | | $ | | $ | ( | $ | | $ | | $ | | |||||||
Equity-based compensation |
| — |
| — |
| — |
| — |
| |
| — |
| |
| |
|
| | ||||||
Issuance of restricted shares | | | — | — | | — | | ( | ( | ||||||||||||||||
Issuance of shares for acquisitions | ( | — | — | — | ( | — | ( | ( | ( | ||||||||||||||||
Repurchase of common stock | ( | ( | — | — | ( | — | ( | ( | ( | ||||||||||||||||
Restricted shares forfeited | ( | ( | — | — | ( | — | ( | | — | ||||||||||||||||
Distributions to noncontrolling interests | — | — | — | — | — | — | — | ( | ( | ||||||||||||||||
Contributions from noncontrolling interests | — | — | — | — | — | — | — | | | ||||||||||||||||
Dividend and distribution declared: | |||||||||||||||||||||||||
Class A common stock ($ | — | — | — | — | ( | — | ( | — | ( | ||||||||||||||||
Unvested restricted stock ($ | — | — | — | — | ( | — | ( | — | ( | ||||||||||||||||
Class B common stock ($ | — | — | — | — | — | — | — | ( | ( | ||||||||||||||||
Net income |
| — |
| — |
| — |
| — |
| — |
| |
| |
| |
|
| | ||||||
Balance as of December 31, 2023 |
| | $ | |
| | $ | | $ | | $ | ( | $ | | $ | | $ | | |||||||
Equity-based compensation |
| — |
| — |
| — |
| — |
| |
| — |
| |
| |
|
| | ||||||
Issuance of restricted shares | | | — | — | | — | | ( | — | ||||||||||||||||
Cash exercise of options |
| |
| — |
| — |
| — |
| |
| — |
| |
| — |
|
| | ||||||
Cashless exercise of options | | | — | — | | — | | — | | ||||||||||||||||
Repurchase of common stock | ( | ( | — | — | ( | — | ( | ( | ( | ||||||||||||||||
Restricted shares forfeited | ( | ( | — | — | ( | — | ( | | — | ||||||||||||||||
Performance shares vested | | | — | — | | — | | ( | — | ||||||||||||||||
Deferred taxes on partnership basis from equity movement | — | — | — | — | ( | — | ( | — | ( | ||||||||||||||||
Dividend and distribution declared: | |||||||||||||||||||||||||
Class A common stock ($ | — | — | — | — | ( | — | ( | — | ( | ||||||||||||||||
Unvested restricted stock ($ | — | — | — | — | ( | — | ( | — | ( | ||||||||||||||||
Class B common stock ($ | — | — | — | — | — | — | — | ( | ( | ||||||||||||||||
Net income |
| — |
| — |
| — |
| — |
| — |
| |
| |
| |
|
| | ||||||
Balance as of December 31, 2024 |
| | $ | |
| | $ | | $ | | $ | ( | $ | | $ | | $ | | |||||||
Equity-based compensation |
| — |
| — |
| — |
| — |
| |
| — |
| |
| |
|
| | ||||||
Issuance of shares for acquisitions | | | — | — | | — | | | | ||||||||||||||||
Issuance of restricted shares | | | — | — | | — | | ( | — | ||||||||||||||||
Cashless exercise of options | | | — | — | | — | | — | | ||||||||||||||||
Repurchase of common stock | ( | ( | — | — | ( | — | ( | ( | ( | ||||||||||||||||
Restricted shares forfeited | ( | ( | — | — | ( | — | ( | | — | ||||||||||||||||
Performance shares vested | | | — | — | | — | | ( | — | ||||||||||||||||
Contributions from noncontrolling interests | — | — | — | — | — | — | — | | | ||||||||||||||||
Deferred taxes on partnership basis from equity movement | — | — | — | — | | — | | — | | ||||||||||||||||
Dividend and distribution declared: | |||||||||||||||||||||||||
Class A common stock ($ | — | — | — | — | ( | — | ( | — | ( | ||||||||||||||||
Unvested restricted stock ($ | — | — | — | — | ( | — | ( | — | ( | ||||||||||||||||
Class B common stock ($ | — | — | — | — | — | — | — | ( | ( | ||||||||||||||||
Net income |
| — |
| — |
| — |
| — |
| — |
| |
| |
| |
|
| | ||||||
Balance as of December 31, 2025 |
| | $ | |
| | $ | | $ | | $ | ( | $ | | $ | | $ | | |||||||
The accompanying notes to consolidated financial statements are an integral part of these financial statements.
F-6
SELECT WATER SOLUTIONS, INC.
CONSOLIDATED STATEMENTS OF CASH FLOWS
(in thousands)
Year Ended December 31, | |||||||||
2025 | | 2024 |
| 2023 | |||||
Cash flows from operating activities | |
| | | |||||
Net income | $ | | $ | | $ | | |||
Adjustments to reconcile net income to net cash provided by operating activities |
| |
| |
| | |||
Depreciation, amortization and accretion |
| |
| |
| | |||
Deferred tax (benefit) expense | ( |
| |
| ( | ||||
Tax receivable agreements expense | |
| |
| | ||||
(Gain) loss on disposal of property and equipment and divestitures |
| ( |
| ( |
| | |||
Equity in losses of unconsolidated entities | |
| |
| | ||||
Credit loss expense |
| |
| |
| | |||
Amortization and write off of debt issuance costs |
| |
| |
| | |||
Inventory adjustments | | ( | | ||||||
Equity-based compensation |
| |
| |
| | |||
Impairments and abandonments |
| |
| |
| | |||
Remeasurement gain on business combination |
| ( |
| — |
| — | |||
Other operating items, net |
| |
| |
| ( | |||
Changes in operating assets and liabilities |
|
|
|
| |||||
Accounts receivable |
| |
| |
| | |||
Prepaid expenses and other assets |
| |
| ( |
| ( | |||
Accounts payable and accrued liabilities |
| ( |
| ( |
| ( | |||
Net cash provided by operating activities |
| |
| |
| | |||
Cash flows from investing activities |
| |
| |
| | |||
Purchase of property and equipment |
| ( |
| ( |
| ( | |||
Purchase of equity-method investment | ( | — | ( | ||||||
Acquisitions, net of cash received |
| ( |
| ( |
| ( | |||
Proceeds received from sales of property and equipment |
| |
| |
| | |||
Net cash used in investing activities |
| ( |
| ( |
| ( | |||
Cash flows from financing activities |
| |
| |
| | |||
Borrowings from revolving line of credit |
| |
| |
| | |||
Payments on revolving line of credit | ( | ( | ( | ||||||
Borrowings from long-term debt | | — | — | ||||||
Payments of finance lease obligations | ( | ( | ( | ||||||
Payment of debt issuance costs |
| ( |
| — |
| — | |||
Dividends and distributions paid |
| ( |
| ( |
| ( | |||
Proceeds from share issuance | — | | — | ||||||
Payments under tax receivable agreements | ( | ( | — | ||||||
Distributions to noncontrolling interests |
| — |
| — |
| ( | |||
Contributions from noncontrolling interests |
| |
| — |
| | |||
Repurchase of common stock |
| ( |
| ( |
| ( | |||
Net cash provided by (used in) financing activities |
| |
| |
| ( | |||
Effect of exchange rate changes on cash |
| |
| ( |
| ( | |||
Net (decrease) increase in cash and cash equivalents |
| ( |
| ( |
| | |||
Cash and cash equivalents, beginning of period |
| |
| |
| | |||
Cash and cash equivalents, end of period | $ | | $ | | $ | | |||
Supplemental cash flow disclosure: |
| |
| |
| | |||
Cash paid for interest | $ | | $ | | $ | | |||
Cash paid for income taxes, net | $ | | $ | | $ | | |||
Supplemental disclosure of noncash operating activities: |
| |
| |
| | |||
Asset retirement obligation revisions | $ | — | $ | | $ | — | |||
Lease liabilities arising from obtaining right-of-use assets | $ | | $ | | $ | | |||
Supplemental disclosure of noncash investing activities: |
| |
| |
| | |||
Issuance (recoupment) of shares for acquisitions | $ | | $ | — | $ | ( | |||
Assets and liabilities transferred in business combination | | — | — | ||||||
Property and equipment obtained by assuming liabilities | $ | | $ | — | $ | — | |||
Capital expenditures included in accounts payable and accrued liabilities | $ | | $ | | $ | | |||
The accompanying notes to consolidated financial statements are an integral part of these financial statements.
F-7
SELECT WATER SOLUTIONS, INC.
NOTES TO CONSOLIDATED FINANCIAL STATEMENTS
NOTE 1—BUSINESS AND BASIS OF PRESENTATION
Description of the business: Select Water Solutions, Inc. (“we,” “Select Inc.,” “Select” or the “Company”), formerly Select Energy Services, Inc., was incorporated as a Delaware corporation on November 21, 2016. On May 8, 2023, Select Energy Services, Inc.’s Fifth Amended and Restated Certificate of Incorporation became effective upon filing with the Secretary of State of the State of Delaware which, among other things, changed the name of the Company from Select Energy Services, Inc. to Select Water Solutions, Inc. to reflect its strategic focus as a water-focused company. We retained our stock ticker “WTTR” trading on the New York Stock Exchange. The Company is a holding company whose sole material asset consists of common units (“SES Holdings LLC Units”) in SES Holdings.
We are a leading provider of sustainable water-management solutions to the energy industry in the U.S. As a leader in the water solutions industry, we place the utmost importance on safe, environmentally responsible management of oilfield water throughout the lifecycle of a well. Additionally, we believe that responsibly managing water resources through our operations to help conserve and protect the environment in the communities in which we operate is paramount to our continued success.
Class A and Class B common stock: As of December 31, 2025, the Company had both Class A and Class B common shares issued and outstanding. Holders of shares of our Class A common stock, par value $
Exchange rights: Under the SES Holdings LLC Agreement, SES Legacy Holdings LLC (“Legacy Owner Holdco”) and its permitted transferees have the right (an “Exchange Right”) to cause SES Holdings to acquire all or a portion of its SES Holdings LLC Units for, at SES Holdings’ election, (i) shares of Class A common stock at an exchange ratio of
Basis of presentation: The accompanying consolidated financial statements of the Company have been prepared in accordance with U.S. GAAP and pursuant to the rules and regulations of the SEC. The consolidated financial statements include the accounts of the Company and all of its majority-owned or controlled subsidiaries. All intercompany accounts and transactions have been eliminated in consolidation.
NOTE 2—SIGNIFICANT ACCOUNTING POLICIES
Use of estimates: The preparation of consolidated financial statements in conformity with GAAP requires management to make estimates and assumptions that affect the reported amounts of assets and liabilities and disclosure of contingent assets and liabilities at the date of the financial statements and the reported amounts of revenues and expenses during the reporting period. Actual results could differ from those estimates.
On an ongoing basis, the Company evaluates its estimates, including those related to the recoverability of long-lived assets and intangibles, useful lives used in depreciation, amortization and accretion, allowance for credit losses, inventory reserve, income taxes, self-insurance liabilities, share-based compensation, contingent liabilities, lease-
F-8
related reasonably certain option exercise assessments, the incremental borrowing rate for leases and the fair value of asset retirement obligations (“AROs”). The Company bases its estimates on historical and other pertinent information that are believed to be reasonable under the circumstances. The accounting estimates used in the preparation of the consolidated financial statements may change as new events occur, as more experience is acquired, as additional information is obtained and as the Company’s operating environment changes.
Cash and cash equivalents: The Company considers all highly liquid investments with an original maturity of three months or less to be cash equivalents.
Allowance for credit losses: The Company’s allowance for credit losses relates to trade accounts receivable. The Company treats trade accounts receivable as one portfolio and records an initial allowance calculated as a percentage of revenue recognized based on a combination of historical information and future expectations. Additionally, the Company adjusts this allowance based on specific information in connection with aged receivables. Historically, credit losses have been incurred when a customer’s financial condition significantly deteriorates, which in some cases leads to bankruptcy. Market volatility is highly uncertain and, as such, the impact on expected losses is subject to judgment and may cause variability in the Company’s allowance for credit losses in future periods.
The change in the allowance for credit losses is as follows:
For the year ended December 31, | |||||||||
2025 | 2024 | | 2023 | ||||||
(in thousands) | |||||||||
Balance at beginning of year | $ | |
| $ | |
| $ | | |
Increase to allowance based on a percentage of revenue |
| |
|
| |
|
| | |
Adjustment based on aged receivable analysis | ( | ( | | ||||||
Charge-offs |
| ( |
|
| ( |
|
| ( | |
Recoveries | |
|
| |
|
| | ||
Balance at end of year | $ | |
| $ | |
| $ | | |
Concentrations of credit and customer risk: Financial instruments that potentially subject the Company to concentrations of credit risk consist principally of cash and cash equivalents and trade accounts receivable. The amounts held in financial institutions periodically exceed the federally insured limit. Management believes that the financial institutions are financially sound and the risk of loss is minimal. The Company minimizes its exposure to counterparty credit risk by performing credit evaluations and ongoing monitoring of the financial stability of its customers. There was
Inventories: The Company values its inventories at lower of cost or net realizable value. Inventory costs are determined under the weighted-average method. Inventory costs primarily consist of chemicals and materials available for resale.
F-9
Property and equipment: Property and equipment are stated at cost less accumulated depreciation.
Depreciation (and amortization of finance lease assets) is calculated on a straight-line basis over the estimated useful life of each asset as noted below:
Asset Classification | | Useful Life (years) |
Land |
| Indefinite |
Buildings and leasehold improvements |
| |
Vehicles and equipment |
| |
Machinery and equipment |
| |
Recycling facilities | ||
Pipelines | ||
Computer equipment and software |
| |
Office furniture and equipment |
| |
Gathering and disposal infrastructure |
|
Depreciation expense related to the Company’s property and equipment, including property under finance leases, was $
Business Combinations: The Company records business combinations using the acquisition method of accounting. Under the acquisition method of accounting, identifiable assets acquired and liabilities assumed are recorded at their acquisition-date fair values. The excess of the purchase price over the estimated fair value is recorded as goodwill and the excess of the fair value over the purchase price is recorded as a bargain purchase gain. Changes in the estimated fair values of net assets recorded for acquisitions prior to the finalization of more detailed analysis, but not to exceed one year from the date of acquisition, will adjust the amount of the purchase price allocable to goodwill. Measurement period adjustments are reflected in the period in which they occur.
Goodwill and other intangible assets: The purchase price of acquired businesses is allocated to its identifiable assets and liabilities based upon estimated fair values as of the acquisition date. Goodwill and other intangible assets are initially recorded at their fair values. Goodwill represents the excess of the purchase price of acquisitions over the fair value of the net assets acquired in a business combination. Goodwill and other intangible assets not subject to amortization are tested for impairment annually or more frequently if events or changes in circumstances indicate that the asset might be impaired. Intangible assets with finite useful lives are amortized either on a straight-line basis over the asset’s estimated useful life or on a basis that reflects the pattern in which the economic benefits of the intangible assets are realized.
Impairment of goodwill, long-lived assets and intangible assets: Long-lived assets, such as property and equipment and finite-lived intangible assets, are evaluated for impairment whenever events or changes in circumstances indicate that its carrying value may not be recoverable. Recoverability is measured by a comparison of its carrying amount to the estimated undiscounted cash flows to be generated by those assets. If the undiscounted cash flows are less than the carrying amount, the Company records impairment losses for the excess of its carrying value over the estimated fair value. The development of future cash flows and the estimate of fair value represent its best estimates based on industry trends and reference to market transactions and are subject to variability. The Company considers the factors within the fair value analysis to be Level 3 inputs within the fair value hierarchy. See “Note 4—Abandonments and Other Costs” for further discussion.
The Company conducts its annual goodwill impairment tests in the fourth quarter of each year, and whenever impairment indicators arise, by examining relevant events and circumstances which could have a negative impact on its goodwill such as macroeconomic conditions, industry and market conditions, cost factors that have a negative effect on earnings and cash flows, overall financial performance, acquisitions and divestitures and other relevant entity-specific events. If a qualitative assessment indicates that it is more likely than not that the fair value of a reporting unit is less
F-10
than its carrying amount, the Company is required to perform a quantitative impairment test for goodwill comparing the reporting unit’s carrying value to its fair value. The Company’s reporting units are based on its organizational and reporting structure. In determining fair values for the reporting units, the Company relies primarily on the income and market approaches for valuation. In the income approach, the Company discounts predicted future cash flows using a weighted-average cost of capital calculation based on publicly-traded peer companies. In the market approach, valuation multiples are developed from both publicly-traded peer companies as well as other company transactions.
If the fair value of a reporting unit is less than its carrying value, goodwill impairment is calculated by subtracting the fair value of the reporting unit from the carrying value. Application of the goodwill impairment test requires judgment, including the identification of reporting units, allocation of assets (including goodwill) and liabilities to reporting units and determining the fair value. The determination of reporting unit fair value relies upon certain estimates and assumptions that are complex and are affected by numerous factors, including the general economic environment and levels of E&P activity of oil and gas companies, the Company’s financial performance and trends and the Company’s strategies and business plans, among others. Unanticipated changes, including immaterial revisions, to these assumptions, could result in a provision for impairment in a future period. Given the nature of these evaluations and their application to specific assets and time frames, it is not possible to reasonably quantify the impact of changes in these assumptions. See Note 4—Impairments and Other Costs for further discussion.
Asset retirement obligations: The ARO liability reflects the present value of estimated costs of plugging wells, removing surface equipment, and returning land to its pre-existing condition associated with the Company’s saltwater disposal facilities and landfills. The fair value of a liability for an ARO is recognized in the period in which it is incurred. These obligations are those for which we have a legal obligation for settlement. The Company utilizes current retirement costs to estimate the expected cash outflows for retirement obligations. The Company also estimates the productive life of disposal wells and landfills, and uses estimated inputs for a credit-adjusted risk-free discount rate and an inflation rate in order to determine the current present value of this obligation. The Company reviews the adequacy of its ARO liabilities whenever indicators suggest the estimated cash flows underlying the liabilities have changed. During the year ended December 31, 2025, incremental accretion expense and long-term ARO liability of $
The change in asset retirement obligations is as follows:
For the year ended December 31, | ||||||
| 2025 | | 2024 | |||
| (in thousands) | |||||
Balance at the beginning of the year |
| $ | |
| $ | |
Accretion expense |
| |
| | ||
Acquired AROs |
| |
| | ||
Additions | | — | ||||
Revisions | — | | ||||
Divested AROs | ( | ( | ||||
Settlements | ( | ( | ||||
Balance at the end of the year |
| $ | |
| $ | |
Short-term ARO liability | | | ||||
Long-term ARO liability | | | ||||
Balance at the end of the year | $ | | $ | | ||
In addition to the obligations described above, the Company may be obligated to remove facilities or perform other remediation upon retirement of certain other assets. However, the fair value of the asset retirement obligation cannot currently be reasonably estimated because the settlement dates are indeterminable. If applicable, the Company
F-11
will record an asset retirement obligation for these assets in the periods in which settlement dates are reasonably determinable.
Retentions: The Company assumes risk of loss through deductibles and self-insured retentions, up to certain levels for losses related to general liability, workers’ compensation and employer’s liability, vehicle liability and health insurance. The Company’s exposure (i.e., the self-insured retention or deductible) per occurrence is $
Defined Contribution Plan: The Company sponsors a defined contribution 401(k) Profit Sharing Plan (the “401(k) Plan”) for the benefit of substantially all employees of the Company. The 401(k) Plan allows eligible employees to make tax-deferred contributions, not to exceed annual limits established by the Internal Revenue Service. The vesting schedule for new hires is
Effective October 1, 2022, the Company began matching contributions of
Severance: During the year ended December 31, 2025, the Company incurred $
During the year ended December 31, 2024, the Company incurred $
Revenue recognition: The Company follows ASC 606, Revenue from Contracts with Customers. See “Note 5—Revenue” for further detail on applying this standard. The Company uses the five step process to recognize revenue which entails (i) identifying contracts with customers; (ii) identifying the performance obligations in each contract; (iii) determining the transaction price; (iv) allocating the transaction price to the performance obligations; and (v) recognizing revenue as we satisfy performance obligations. The Company only applies the five-step model to contracts when it is probable that the Company will collect the consideration it is entitled to in exchange for the goods or services transferred to the customer. Revenue from the Company’s Water Services and Water Infrastructure segments is typically recognized over the course of time, whereas revenue from the Company’s Chemical Technologies segment is typically recognized upon change in control. Revenue generated by each of the Company’s revenue streams are outlined as follows:
Water Infrastructure and Water Services—The Company provides water-related services to customers, including the sourcing and transfer of water, produced water gathering, treatment and reuse, the containment of fluids, measuring and monitoring of water, the filtering and treatment of fluids, well testing and handling, transportation and recycling or disposal of fluids. The Company recognizes revenue as services are performed.
The Company’s agreements with its customers are often referred to as “price sheets” and sometimes provide pricing for multiple services. However, these agreements generally do not authorize the performance of specific services or provide for guaranteed throughput amounts. As customers are free to choose which services, if any,
F-12
to use based on the Company’s price sheet, the Company prices its separate services on the basis of their standalone selling prices. Customer agreements generally do not provide for performance-, cancellation-, termination-, or refund-type provisions. Services based on price sheets with customers are generally performed under separately-issued “work orders” or “field tickets” as services are requested. Multiple service lines of the Company’s Water Services and Water Infrastructure segments are sometimes part of the same arrangement. In these instances, revenue for the applicable service lines are recognized concurrently when delivered. The Company recognizes revenue from certain sales when title passes to the customer, the customer assumes risks and rewards of ownership, collectability is reasonably assured and delivery occurs as directed by the customer. Additionally, asset rentals are recognized on a straight-line basis.
Chemical Technologies Product Sales—The Company develops, manufactures and markets a full suite of chemicals utilized in hydraulic fracturing, stimulation, cementing and well completions, including polymers that create viscosity, crosslinkers, friction reducers, surfactants, buffers, breakers and other chemical technologies, to leading pressure pumping service companies in the U.S. The Company also provides production chemicals solutions, which are applied to underperforming wells in order to enhance well performance and reduce production costs through the use of production treating chemicals, corrosion and scale monitoring, chemical inventory management, well failure analysis and lab services.
Chemical Technologies products are generally sold under sales agreements based upon purchase orders or contracts with customers that do not include right of return provisions or other significant post-delivery obligations. The Company’s products are produced in a standard manufacturing operation, even if produced to the customer’s specifications. The prices of products are fixed and determinable and are established in price lists or customer purchase orders. The Company recognizes revenue from product sales when title passes to the customer, the customer assumes risks and rewards of ownership, collectability is reasonably assured and delivery occurs as directed by the customer.
Equity-based compensation: The Company accounts for equity-based awards for restricted stock awards, restricted stock units, and stock-settled appreciation awards by measuring the awards at the date of grant and recognizing the grant-date fair value as an expense using either straight-line or accelerated attribution, depending on the specific terms of the award agreements over the requisite service period, which is usually equivalent to the vesting period. The Company expenses awards with graded-vesting service conditions on a straight-line basis and accounts for forfeitures as they occur. The Company accounts for performance share units by remeasuring the awards at the end of each reporting period based on the period-end closing share price, factoring in the percentage expected to vest, and the percentage of the service period completed.
Fair value measurements: The Company measures certain assets and liabilities pursuant to accounting guidance, which establishes a three-tier fair value hierarchy and prioritizes the inputs used in measuring fair value. Level 1 inputs are unadjusted quoted prices in active markets for identical assets or liabilities. Level 2 inputs are quoted prices or other market data for similar assets and liabilities in active markets, or inputs that are observable for the asset or liability, either directly or indirectly through market corroboration, for substantially the full term of the asset or liability. Level 3 inputs are unobservable inputs based upon the Company’s own judgment and assumptions used to measure assets and liabilities at fair value. See “Note 13—Fair Value Measurement” for further discussion.
Income taxes: Select Inc. is subject to U.S. federal, state and local and non-U.S. income taxes as a corporation. SES Holdings and its subsidiaries, with the exception of certain corporate subsidiaries, are treated as flow-through entities for U.S. federal income tax purposes and as such, are generally not subject to U.S. federal income tax at the entity level. Rather, the tax liability with respect to their taxable income is passed through to their members or partners. Select Inc. recognizes a tax liability on its allocable share of SES Holdings’ taxable income. The Texas Margin Tax is classified as an income tax for accounting purposes. As it applies to the Company, an accrual for this tax is recognized within the income tax provision when appropriate.
The Company and its subsidiaries account for income taxes under the asset and liability method. Under this method, deferred tax assets and liabilities are recognized for the estimated future tax consequences attributable to differences between the financial statement carrying amounts of existing assets and liabilities and their respective tax
F-13
basis. Deferred tax assets and liabilities are measured using enacted tax rates in effect for the year in which those temporary differences are expected to be recovered or settled pursuant to the provisions of ASC 740, Income Taxes. The effect on deferred tax assets and liabilities of a change in tax rate is recognized in earnings in the period that includes the enactment date. Valuation allowances are established when necessary to reduce deferred tax assets to the amounts more likely than not to be realized.
The determination of the provision for income taxes requires judgment, use of estimates and the interpretation and application of complex tax laws. Judgment is required in assessing the timing and amounts of deductible and taxable items and the probability of sustaining uncertain tax positions. The benefits of uncertain tax positions are recorded in the Company’s financial statements only after determining a more likely than not probability that the uncertain tax positions will withstand challenge, if any, from taxing authorities. When facts and circumstances change, the Company reassesses these probabilities and records any changes through the provision for income taxes. The Company recognizes interest and penalties relating to uncertain tax provisions as a component of tax expense. The Company identified no material uncertain tax positions as of December 31, 2025 and 2024. See “Note 15—Income Taxes” for further discussion.
Tax Receivable Agreements: In connection with the Select 144A Offering, the Company entered into two TRAs with Legacy Owner Holdco and certain other affiliates of the then holders of SES Holdings LLC Units (each such person and any permitted transferee thereof, a “TRA Holder,” and together, the “TRA Holders”). The 144A Offering represented a reorganization transaction between entities under common control and was recorded based on the historical carrying amounts of affected assets and liabilities in accordance with ASC 805-50, Business Combinations – Related Issues. Accordingly, the TRAs liabilities are accounted for in accordance with ASC 450, Contingencies, on a gross undiscounted basis, for amounts payable under the provisions of the TRAs that have been determined to be probable of occurring for amounts that are reasonably estimable. Changes in estimated TRAs liabilities are recognized as TRAs expense on the consolidated statements of operations. Additionally, following the Company’s acquisition (or deemed acquisition for U.S. federal income tax purposes) of all or a portion of a TRA Holder’s SES Holdings LLC Units pursuant to the exercise of the Exchange Right or the Company’s Call Right, the Company would record any adjustments under the TRAs at the gross undiscounted amount as an increase to the liability with an offset to additional paid-in capital for the amount of expected future payments that are determined to be probable of occurring for amounts that are reasonably estimable.
The first of the TRAs, which the Company entered into with Legacy Owner Holdco and Crestview Partners II GP, L.P. (“Crestview GP”), generally provides for the payment by the Company to such TRA Holders of
The second of the TRAs, which the Company entered into with an affiliate of Legacy Owner Holdco and Crestview GP, generally provides for the payment by the Company to such TRA Holders of
The Company will retain the benefit of the remaining
F-14
therefore recorded liabilities of $
Dividends: During 2025, the Company paid $
Segment reporting: The Company has
The Water Infrastructure segment consists of the Company’s fixed infrastructure assets, including operations associated with our water distribution pipeline infrastructure, our water recycling facilities, and our produced water gathering pipelines, SWDs, and our solids management facilities, primarily serving E&P companies.
The Water Services segment primarily consists of the Company’s water-related services businesses, including water sourcing, water transfer, fluids hauling, water monitoring, water containment and water network automation, primarily serving E&P companies. Additionally, this segment includes the operations of our Peak Rentals businesses.
The Chemical Technologies segment provides technical solutions, products and expertise related to chemical applications in the oil and gas industry. We develop, manufacture, manage logistics and provide a full suite of chemicals used in hydraulic fracturing, stimulation, cementing and well completions for customers ranging from pressure pumpers to major integrated and independent oil and gas producers. This segment also utilizes its chemical experience and lab testing capabilities to customize tailored water treatment solutions designed for the recycling and treatment of produced water and to optimize the fracturing fluid system in conjunction with the quality of water used in well completions.
Equity Investments: For investments in subsidiaries that are not wholly owned, but where the Company exercises control, the equity held by the minority owners and their portion of net income or loss are reflected as noncontrolling interests. Investments in entities in which the Company exercises significant influence over operating and financial policies are accounted for using the equity method, and investments in entities for which the Company does not have significant control or influence are accounted for using the cost-method or other appropriate basis as applicable. As of December 31, 2025, the Company had
F-15
circumstances indicate that the fair value of its investment is less than its carrying value and the reduction in value is other than temporary, the reduction in value is recognized in earnings.
On February 14, 2025, the Company entered into a new partnership arrangement through AV Farms pursuant to a limited partnership agreement (the “LPA”) by and among SWR, a wholly-owned subsidiary of the Company, C&A and Geneses, as limited partners, and AV Farms Management, LLC as the general partner (“AV GP”), effective as of February 28, 2025. SWR contributed $
AV Farms was formed to consolidate one of the largest water holdings and storage portfolios in Colorado in order to serve agricultural, municipal, and industrial stakeholders in the region. The scale and location of the assets provides AV Farms the ability to pursue innovative water sharing agreements that provide reliable water supply for all stakeholders. Collaboration, efficiency and technology are core to AV Farms goal of developing an integrated water network in the Colorado Arkansas River Valley. AV Farms is also one of the largest irrigated farming operations in the Arkansas River Valley and is looking to expand this operation to support all of the many interconnected stakeholders in the region.
SWR contributed $
Beginning February 29, 2028, and continuing for 24 months thereafter, SWR will have a call option and C&A and Geneses will have corresponding put options regarding their interests in AV Farms. Under the call option, SWR may exercise its right to acquire all of each of C&A’s and Geneses’s respective interests in AV Farms for an amount which represents the greater of (i) a specified net internal rate of return on their respective capital contributions and (ii) a certain net multiple on invested capital. Under the put options, each of C&A and Geneses has the right to require that SWR acquire all of their respective interests in AV Farms for an amount which represents the lesser of (i) a specified net internal rate of return on their respective capital contributions and (ii) a certain net multiple of invested capital. The options allow for partial settlement in shares of the Company’s Common Stock, valued at a 10-day average closing price prior to exercise. The Company guarantees certain obligations under the LPA but is not otherwise a party to it.
Our investments in unconsolidated entities are summarized below:
Year | As of December 31, | As of December 31, | ||||||||||
Investment | Ownership % | attained | Accounting method | 2025 |
| 2024 | ||||||
(in thousands) | ||||||||||||
Water Infrastructure | ||||||||||||
AV Farms, LP | 2025 | Equity-method | $ | | $ | — | ||||||
Water Services | ||||||||||||
ESG Solutions Group, Inc. | 2020 | Equity-method | | | ||||||||
ICE Thermal, Inc.(1) | 2021 | Equity-method | | | ||||||||
AquaNyx Midstream LP | 2021 | Equity-method | | | ||||||||
Total investment in unconsolidated entities | $ | | $ | | ||||||||
| (1) | Ownership percentage decreased during the year ended December 31, 2025 due to contributions from other owners. Select ownership was |
F-16
Reclassifications: Certain reclassifications have been made to the Company’s prior period consolidated financial information to conform to the current year presentation. These presentation changes did not impact the Company’s consolidated net income, consolidated cash flows, total assets, total liabilities or total stockholders’ equity.
Newly adopted accounting pronouncements: In December 2023, the Financial Accounting Standards Board (“FASB”) issued Accounting Standards Update (“ASU”) 2023-09, “Income Taxes (Topic 740): Improvements to Income Tax Disclosures” (“ASU 2023-09”). The Company has adopted the standard for this annual reporting period on a prospective basis. The Company’s annual income tax disclosures have been expanded to provide additional transparency into the drivers of its effective tax rate and cash taxes paid, net of refunds received, to various jurisdictions. The disclosures reflect new quantitative thresholds and expanded presentation requirements introduced under ASU 2023-09. See Note 15 – Income Taxes for the expanded disclosures.
Accounting pronouncements not yet adopted: In November 2024, the FASB issued ASU 2024-03, "Income Statement - Reporting Comprehensive Income - Expense Disaggregation Disclosures (Subtopic 220-40)" ("ASU 2024-03"). The amendments in this update enhance disclosures about a public business entity’s expenses and provide more detailed information about the types of expenses included in certain expense captions in the consolidated financial statements. ASU 2024-03 is effective for the Company for the year ending December 31, 2027, and for interim periods thereafter. The Company is currently evaluating the impacts of the adoption of ASU 2024-03.
NOTE 3—ACQUISITIONS
The following table presents key information connected with our 2025, 2024 and 2023 acquisitions (in thousands, except share amounts):
Assets and Operations Acquired | Acquisition Date | Shares Issued | Cash Consideration | Acquisition related costs for Asset Acquisitions | Other Consideration | Value of Shares Issued | Total Consideration | Segments | |||||||||
Eight Smaller Asset Acquisitions | Multiple 2025 Dates | — | $ | | $ | — | $ | — | $ | — | $ | | Water Infrastructure | ||||
One Asset Acquisition | August 29, 2025 | — | | — | — | — | | Corporate-Other | |||||||||
Omni | July 1, 2025 | | | — | | | | Water Infrastructure | |||||||||
One Smaller Asset Acquisition | April 1, 2025 | — | | — | — | — | | Water Services | |||||||||
Eight Smaller Asset Acquisitions | Multiple 2024 Dates | — | | | — | — | | Water Infrastructure | |||||||||
Bobcat | April 18, 2024 | — | | — | — | — | | Water Infrastructure | |||||||||
Trinity | April 1, 2024 | — | | — | — | — | | Water Infrastructure | |||||||||
Buckhorn | March 1, 2024 | — | | — | — | — | | Water Infrastructure | |||||||||
Iron Mountain Energy | January 8, 2024 | — | | — | — | — | | Water Infrastructure | |||||||||
Tri-State Water Logistics | January 3, 2024 | — | | — | — | — | | Water Infrastructure | |||||||||
Rockies produced water gathering and disposal infrastructure | January 1, 2024 | — | | — | — | — | | Water Infrastructure | |||||||||
Four Smaller Asset Acquisitions | Multiple 2023 Dates | — | | — | — | — | | Water Infrastructure | |||||||||
Asset Acquisition | April 3, 2023 | — | | — | — | — | | Water Services | |||||||||
Asset Acquisition | January 31, 2023 | — | | | — | — | | Water Infrastructure | |||||||||
Total | | $ | | $ | | $ | | $ | | $ | |
F-17
2025 Business Combination with Omni
On July 1, 2025, the Company acquired certain assets and operations of Omni in the Bakken region. The acquired assets include:
| ● | A solids waste landfill with approximately |
| ● | A processing, recovery, and disposal facility for reclaiming diesel and other hydrocarbons from oilfield waste streams; |
| ● |
| ● | A commercial oil storage tank farm with total capacity of approximately |
The purchase consideration included (i) $
This acquisition enhances the Company’s Water Infrastructure segment by expanding landfill and disposal capacity in the Bakken and introducing new service offerings. The transaction was accounted for as a business combination under the acquisition method in accordance with ASC 805. The Company engaged third-party valuation experts to assist in the purchase price allocation for the net assets received. These estimates, judgments, assumptions and valuation of the property and equipment acquired, current assets, current liabilities and long-term liabilities have not been finalized as of December 31, 2025. The business combination accounting is preliminary due to continuing efforts to reach agreement on a pre-existing matter related to certain acquired assets. The Company also used a third-party analysis for the valuation of property and equipment divested, which resulted in a $
F-18
The following table summarizes the consideration transferred and the estimated fair value of identified assets acquired and liabilities assumed at the date of acquisition:
Preliminary purchase price allocation | Amount | ||
Consideration transferred | (in thousands) | ||
Cash paid | $ | | |
Class A common stock ( | | ||
Property and equipment ($ | | ||
Other assets and liabilities transferred/assumed | | ||
Total consideration transferred |
| | |
Less: identifiable assets acquired and liabilities assumed |
| ||
Working capital |
| ( | |
Property and equipment |
| | |
Long-term ARO | ( | ||
Total identifiable net assets acquired | | ||
Goodwill |
| | |
Fair value allocated to net assets acquired |
| $ | |
2025 Asset Acquisitions
During the year ended December 31, 2025, the Company acquired certain assets and associated liabilities in the Permian Basin from
F-19
2024 Business Acquisitions
A summary of the consideration transferred and the estimated fair value of identified assets acquired and liabilities assumed as of December 31, 2024 for the Company’s 2024 business acquisitions is located below (in thousands):
Purchase price allocation | Bobcat | Trinity | Buckhorn | Iron Mountain Energy | Tri-State Water Logistics | Rockies Infrastructure | Total 2024 Acquisitions | ||||||||||||||
(in thousands) | |||||||||||||||||||||
Consideration transferred | |||||||||||||||||||||
Cash consideration(1) | $ | | $ | | $ | | $ | | $ | | $ | | $ | | |||||||
Total consideration transferred | | | | | | | | ||||||||||||||
Less: identifiable assets acquired and liabilities assumed | |||||||||||||||||||||
Working capital | ( | ( | | ( | ( | ( | ( | ||||||||||||||
Property and equipment | | | | | | | | ||||||||||||||
Right-of-use assets | — | | — | — | | — | | ||||||||||||||
Customer relationships | | — | | — | | | | ||||||||||||||
Deferred tax liabilities | — | — | ( | — | — | — | ( | ||||||||||||||
Long-term ARO | ( | ( | ( | ( | ( | ( | ( | ||||||||||||||
Long-term lease liabilities | — | ( | — | — | ( | — | ( | ||||||||||||||
Total identifiable net assets acquired | | | | | | | | ||||||||||||||
Goodwill | — | — | | — | | | | ||||||||||||||
Fair value allocated to net assets acquired | $ | | $ | | $ | | $ | | $ | | $ | | $ | | |||||||
| (1) | During the year ended December 31, 2025, the Company paid $ |
Bobcat Acquisition
On April 18, 2024, the Company completed the acquisition of equity interests of certain subsidiaries of Bobcat SWIW Holdings, LLC (the “Bobcat Acquisition”). The Company paid total consideration of $
The Bobcat Acquisition was accounted for as a business combination under the acquisition method of accounting. When determining the fair values of assets acquired and liabilities assumed, management made estimates, judgments and assumptions. These estimates, judgments, assumptions and valuation of the property and equipment acquired, intangible assets, current assets and current liabilities were finalized as of September 30, 2024. The assets acquired and liabilities assumed are included in the Company’s Water Infrastructure segment. The Company incurred $
Trinity Acquisition
On April 1, 2024, the Company completed the acquisition of Trinity Acquisition Holdings, LLC (d/b/a Trinity Environmental Services) and related entities (the “Trinity Acquisition”). The Company paid initial consideration of $
F-20
The Trinity Acquisition was accounted for as a business combination under the acquisition method of accounting. When determining the fair values of assets acquired and liabilities assumed, management made estimates, judgments and assumptions. The Company engaged third-party valuation experts to assist in the purchase price allocation. These estimates, judgments, assumptions and valuation of the property and equipment acquired, intangible assets, current assets and current liabilities and have been finalized as of December 31, 2024. The assets acquired and liabilities assumed are included in the Company’s Water Infrastructure segment and the goodwill acquired is deductible for income tax purposes. The Company incurred $
Buckhorn Acquisition
On March 1, 2024, the Company completed the acquisition of equity interests of certain subsidiaries of Buckhorn Waste Services, LLC and Buckhorn Disposal, LLC (the “Buckhorn Acquisition”). The Company paid initial consideration of $
The Buckhorn Acquisition was accounted for as a business combination under the acquisition method of accounting. When determining the fair values of assets acquired and liabilities assumed, management made estimates, judgments and assumptions. The Company engaged third-party valuation experts to assist in the purchase price allocation. These estimates, judgments, assumptions and valuation of the property and equipment acquired, intangible assets, current assets and current liabilities and have been finalized as of December 31, 2024. The assets acquired and liabilities assumed are included in the Company’s Water Infrastructure segment and a portion of the goodwill acquired is deductible for income tax purposes. The goodwill reflects the strategic benefits of expanding the landfill footprint in the Bakken region and the synergies of integrating our existing assets and activities with Buckhorn’s operations. The Company incurred $
Iron Mountain Energy Acquisition
On January 8, 2024, the Company acquired substantially all of the assets and operations of Iron Mountain Energy, LLC (the “Iron Mountain Acquisition”). The Company paid total consideration of $
The Iron Mountain Acquisition was accounted for as a business combination under the acquisition method of accounting. When determining the fair values of assets acquired and liabilities assumed, management made estimates, judgments and assumptions. The Company engaged third-party valuation experts to assist in the purchase price allocation. These estimates, judgments, assumptions and valuation of the property and equipment acquired, intangible assets, current assets, current liabilities and long-term liabilities were finalized as of September 30, 2024. The assets acquired and liabilities assumed are included in the Company’s Water Infrastructure segment and the goodwill acquired is deductible for income tax purposes. The Company incurred $
Tri-State Water Logistics Acquisition
On January 3, 2024, the Company acquired the assets and operations of Tri-State Water Logistics, LLC and certain of its affiliates (the “Tri-State Acquisition”). The Company paid total consideration of $
F-21
The Tri-State Acquisition was accounted for as a business combination under the acquisition method of accounting. When determining the fair values of assets acquired and liabilities assumed, management made estimates, judgments and assumptions. The Company engaged third-party valuation experts to assist in the purchase price allocation. These estimates, judgments, assumptions and valuation of the property and equipment acquired, intangible assets, current assets, current liabilities and long-term liabilities were finalized as of September 30, 2024. The assets acquired and liabilities assumed are included in the Company’s Water Infrastructure segment and the goodwill acquired is deductible for income tax purposes. The goodwill reflects the strategic benefits of enhancing Select’s fluids and solids treatment and disposal footprint in the Haynesville region and the synergies from integrating Select’s existing assets and operations with Tri-State’s operations. The Company incurred $
Rockies produced water gathering and disposal infrastructure Acquisition
On January 1, 2024, the Company acquired certain disposal assets, operations and disposal and recycling permits in the Rockies region (the “Rockies Infrastructure Acquisition”). The Company paid total consideration of $
The Rockies Infrastructure Acquisition was accounted for as a business combination under the acquisition method of accounting. When determining the fair values of assets acquired and liabilities assumed, management made estimates, judgments and assumptions. The Company engaged third-party valuation experts to assist in the purchase price allocation. These estimates, judgments, assumptions and valuation of the property and equipment acquired, intangible assets, current assets, current liabilities and long-term liabilities were finalized as of September 30, 2024. The assets acquired and liabilities assumed are included in the Company’s Water Infrastructure segment and the goodwill acquired is deductible for income tax purposes. The goodwill reflects the strategic benefits of expanding the disposal footprint in the Rockies region and the synergies from integrating our existing assets and activities with the Rockies Infrastructure disposal well and potential to drill more disposal wells on the acquired property. The Company incurred $
2024 Asset Acquisitions
During the year ended December 31, 2024, the Company acquired certain assets and associated liabilities, primarily in the Permian Basin and Northeast Ohio, from
2023 Asset Acquisitions
During the year ended December 31, 2023, the Company acquired certain assets, revenue-producing contracts and associated liabilities, primarily in the Permian Basin, from multiple entities for $
F-22
NOTE 4—ABANDONMENTS AND OTHER COSTS
A summary of impairments to and abandonment of property and equipment for the years ended December 31, 2025, 2024 and 2023 is as follows:
Year ended December 31, | |||||||||
2025 | 2024 | | 2023 | ||||||
(in thousands) | |||||||||
Abandonment of property and equipment | |||||||||
Water Infrastructure | $ | | $ | | $ | | |||
Water Services | | | | ||||||
Other | | | — | ||||||
Total abandonment of property and equipment | $ | | $ | | $ | | |||
During the year ended December 31, 2025, the Company recognized $
The $
A summary of severance and lease abandonment costs for the years ended December 31, 2025, 2024 and 2023 is as follows:
Year ended December 31, | |||||||||
2025 | 2024 | | 2023 | ||||||
(in thousands) | |||||||||
Severance | |||||||||
Selling, general and administrative | $ | | $ | | $ | — | |||
Total severance expense | $ | | $ | | $ | — | |||
Lease abandonment costs | |||||||||
Water Infrastructure | $ | | $ | | $ | | |||
Water Services | | | | ||||||
Chemical Technologies | — | — | | ||||||
Total lease abandonment costs | $ | | $ | | $ | | |||
See “Note 2—Significant Accounting Policies” for further detail on the 2025 and 2024 severance.
On February 21, 2023, the Company announced a rebranding initiative that occurred during the first half of 2023. As a result of this initiative, our existing trademarks are no longer considered indefinite-lived and will be measured for abandonment whenever events or changes in circumstances indicate that its carrying value may not be recoverable. The rebranding announcement qualified as a triggering event, and the Company tested the existing trademarks for abandonment. This evaluation included significant judgment, including discount rates based on our weighted-average cost of capital and the royalty rate. This resulted in $
F-23
trademarks using the relief-from-royalty method, which was recorded in the Chemical Technologies segment within impairments and abandonments on the accompanying consolidated statements of operations.
NOTE 5—REVENUE
The Company follows ASC 606, Revenue from Contracts with Customers, for most revenue recognition, which provides a five-step model for determining revenue recognition for arrangements that are within the scope of the standard: (i) identify the contract(s) with a customer; (ii) identify the performance obligations in the contract; (iii) determine the transaction price; (iv) allocate the transaction price to the performance obligations in the contract; and (v) recognize revenue when (or as) the entity satisfies a performance obligation. The Company applies the five-step model only to contracts when it is probable that we will collect the consideration the Company is entitled to in exchange for the goods or services the Company transfers to the customer. The accommodations and rentals revenue continues to be guided by ASC 842 – Leases, which is discussed further below.
The following factors are applicable to the Company’s segments for the years 2025, 2024 and 2023, respectively:
| ● | The vast majority of Water Services and Chemical Technologies customer agreements are short-term, lasting less than one year. Water Infrastructure contains both short-term and long-term agreements. |
| ● | Contracts are seldom combined together as virtually all of our customer agreements constitute separate performance obligations. Each job or project is typically distinct, thereby not interdependent or interrelated with other customer agreements. |
| ● | Most contracts allow either party to terminate at any time without substantive penalties. If the customer terminates the contract, the Company is unconditionally entitled to the payments for the services rendered and products delivered to date. This largely applies to Water Services and Chemical Technologies. |
| ● | Contract terminations before the end of the agreement are rare. |
| ● | Sales returns are rare and no sales return assets have been recognized on the balance sheet. |
| ● | There are minimal volume discounts. |
| ● | There are no service-type warranties. |
| ● | There is no long-term customer financing. |
| ● | Taxes assessed by government authorities included on customer invoices are excluded from revenue. |
In the Water Infrastructure and Water Services segments, performance obligations arise in connection with services provided to customers in accordance with contractual terms, in an amount the Company expects to collect. Services are generally sold based on customer orders or contracts with customers that include fixed or determinable prices. Revenues are generated by services rendered and measured based on the output generated, which is usually simultaneously received and consumed by customers at their job sites. As a multi-job site organization, contract terms, including the pricing for the Company’s services, are negotiated on a job site level on a per-job basis. Most jobs are completed in a short period of time, usually between one day and one month. Revenue is recognized as performance obligations are completed on a daily, hourly or per-unit basis with unconditional rights to consideration for services rendered reflected as accounts receivable trade, net of allowance for credit losses. In cases where a prepayment is received before the Company satisfies its performance obligations, a contract liability is recorded in accrued expenses and other current liabilities. Final billings generally occur once all of the proper approvals are obtained. Mobilization and demobilization are factored into the pricing for services. Billings and costs related to mobilization and demobilization are not material for customer agreements that start in one period and end in another. The Company recognizes revenue
F-24
from certain sales when title passes to the customer, the customer assumes risks and rewards of ownership, collectability is reasonably assured and delivery occurs as directed by the customer.
Within the Water Infrastructure segment, we have contracts containing acreage dedications, areas of mutual interest AMIs, wellbore dedications and MVCs. Acreage dedications are longer term contracts pursuant to which a customer dedicates certain activities or volumes to Select within a defined set of the customer’s leased acreage, typically committing to us all water demanded by future wells they complete or produced from current and future wells that they operate, and we commit to provide, gather, recycle or dispose such water volumes. AMI arrangements similarly are defined by a geographic right to current and future customer volumes, though AMIs may encompass a broader geographic area beyond a customer’s existing leasehold acreage. Wellbore dedications are similar to acreage dedications; however, they limit the contractual obligations to a defined set of existing or future wells. Under our MVC agreements our customers guarantee to deliver certain minimum volumes of produced water to our pipeline networks at an agreed upon fee or pay a deficiency fee for the minimum volume that is not met for a specified period. In most cases, these contracts are covenant to the land and assets they encompass.
The following table presents supplementary information regarding accounts receivable arising from rental agreements, accounts receivable related to contracts with customers and contract liabilities associated with contracts with customers. The Company did not have any contract assets during the periods presented. Contract liabilities of $
As of December 31, | ||||||||||||
| 2025 | 2024 | 2023 | | 2022 | |||||||
(in thousands) | ||||||||||||
Trade Accounts Receivable - Lease Arrangements (ASC 842)(1) | $ | | $ | | $ | | $ | | ||||
Trade Accounts Receivable - Revenue (ASC 606)(1) | | | | | ||||||||
Contract liabilities - Revenue (ASC 606) | ( | ( | ( | ( | ||||||||
| (1) | Trade accounts receivable is net of the allowance for credit losses and includes related party receivables. |
Accommodations and rentals revenue is included in the Water Services segment and the Company accounts for accommodations and rentals agreements as an operating lease. The Company recognizes revenue from renting equipment on a straight-line basis. Accommodations and rental contract periods are generally daily, weekly or monthly. The average lease term is less than three months and as of December 31, 2025, there were no material rental agreements in effect lasting more than one year. During 2025, 2024 and 2023, approximately $
In the Chemical Technologies segment, the typical performance obligation is to provide a specific quantity of chemicals to customers in accordance with the customer agreement in an amount the Company expects to collect. Products and services are generally sold based upon customer orders or contracts with customers that include fixed or determinable prices. Revenue is recognized as the customer takes title to chemical products in accordance with the agreement. Products may be provided to customers in packaging or delivered to the customers’ containers through a hose. In some cases, the customer takes title to the chemicals upon consumption from storage containers on their property, where the chemicals are considered inventory until customer usage. In cases where the Company delivers products and recognizes revenue before collecting payment, the Company has an unconditional right to payment reflected in accounts receivable trade, net of allowance for credit losses. Customer returns are rare and immaterial, and there were no material in-process customer agreements for this segment as of December 31, 2025 lasting greater than one year.
F-25
The following table sets forth certain financial information with respect to the Company’s disaggregation of revenues by geographic location:
Year ended December 31, | |||||||||
| 2025 | 2024 | | 2023 | |||||
(in thousands) | |||||||||
Geographic Region | |||||||||
Permian Basin | $ | | $ | | $ | | |||
Rockies | | | | ||||||
Marcellus/Utica | | | | ||||||
Eagle Ford | | | | ||||||
Mid-Continent | | | | ||||||
Bakken | | | | ||||||
Haynesville/E. Texas | | | | ||||||
Eliminations and other regions | ( | ( | ( | ||||||
Total | $ | | $ | | $ | | |||
In the Water Infrastructure segment, the most recent top
NOTE 6—LEASES
As of December 31, 2025, the Company was the lessee for
The Company’s operating leases are primarily for (i) housing personnel for operations, (ii) operational yards for storing and staging equipment, (iii) vehicles and equipment used in operations, (iv) facilities used for back-office functions and (v) equipment used for back-office functions. The majority of the Company’s long-term lease expenses are at fixed prices.
Leases with an initial term of 12 months or less are not recorded on the consolidated balance sheets and the Company recognizes lease expense for these leases on a straight-line basis over the lease term. The Company has a significant number of short-term leases, including month-to-month agreements, some of which continue in perpetuity until the lessor or the Company terminates the lease agreement. The majority of the Company’s lease expenses are in connection with short-term agreements, including expenses incurred hourly, daily, monthly and for other durations of time of one year or less. Due to the volatility of the price of a barrel of oil and the short-term nature of the vast majority of customer agreements, the Company must have flexibility to continuously scale operations at multiple locations. Consequently, the Company avoids committing to long-term agreements with numerous equipment rentals, vehicle fleet agreements and man-camp agreements, unless a business case supports a longer term agreement. Consequently, the Company’s future lease commitments as of December 31, 2025 do not reflect all of the Company’s short-term lease commitments.
Certain short-term and month-to-month vehicle and equipment leases have residual value guarantees if the Company decides to turn in vehicles and equipment before the end of the lease term. Vehicles and equipment turned in early result in sale proceeds, which have historically been equal to or greater than the residual value guarantees. There are no residual value guarantees if the vehicles or equipment is fully paid off.
F-26
When available, the Company uses the rate implicit in the lease to discount lease payments to present value; however, most of the Company’s leases do not provide a readily determinable implicit rate. Therefore, the Company estimates the incremental borrowing rate based on what it would pay to borrow on a collateralized basis, over a similar term based on information available at lease commencement.
The Company’s lease arrangements may contain both lease and non-lease components. The Company has elected to combine and account for lease and non-lease components as a single lease component for its leases.
The Company’s variable lease costs are comprised of variable royalties, variable common area maintenance, and variable reimbursement of lessor insurance and property taxes. Variable lease costs were $
The lease disclosures in this “Note 6—Leases” exclude revenue governed by the lease standard associated with the Company’s accommodations and rentals business, as all customer agreements are short-term. See “Note 5—Revenue” for a comprehensive discussion on revenue recognition.
During the years ended December 31, 2025 and 2024, the Company made the decision to abandon operations at multiple Water Services locations. As a result, the Company recorded right-of-use asset impairment charges of $
The financial impact of leases is listed in the tables below:
As of December 31, | ||||||||
Balance Sheet | | Classification | | 2025 | | 2024 | ||
(in thousands) | ||||||||
Assets | ||||||||
Right-of-use assets | Long-term right-of-use assets | $ | | $ | | |||
Finance lease assets | | | ||||||
Liabilities | ||||||||
Operating lease liabilities ― ST | Current operating lease liabilities | $ | | $ | | |||
Operating lease liabilities ― LT | Long-term operating lease liabilities | | | |||||
Finance lease liabilities ― ST | Current portion of finance lease obligations | | | |||||
Finance lease liabilities ― LT | | | ||||||
F-27
Year ended December 31, | |||||||||||
Statements of Operations and Cash Flows | | Classification | | 2025 | 2024 | 2023 | |||||
(in thousands) | |||||||||||
Operating lease cost: | |||||||||||
Operating lease cost ― fixed | Cost of revenue and selling, general and administrative | $ | | $ | | $ | | ||||
Lease abandonment costs | Lease abandonment costs | | | | |||||||
Short-term agreements: | Cost of revenue | $ | | $ | | $ | | ||||
Finance lease cost: | |||||||||||
Amortization of leased assets | Depreciation and amortization | $ | | $ | | $ | | ||||
Interest on lease liabilities | Interest expense, net | | | | |||||||
Lessor income: | |||||||||||
Sublease income | Cost of revenue, selling, general and administrative and lease abandonment costs | $ | | $ | | $ | | ||||
Lessor income | Cost of revenue | | | | |||||||
Statement of cash flows | |||||||||||
Cash paid for operating leases | Operating cash flows | $ | | $ | | $ | | ||||
Cash paid for finance leases lease interest | Operating cash flows | | | | |||||||
Cash paid for finance leases | Financing cash flows | | | | |||||||
As of December 31, | ||||||
Lease Term and Discount Rate | | 2025 | | 2024 | ||
Weighted-average remaining lease term (years) | ||||||
Operating leases | ||||||
Finance leases | ||||||
Weighted-average discount rate | ||||||
Operating leases | | % | | % | ||
Finance leases | | % | | % | ||
F-28
The Company has the following operating and finance lease commitments as of December 31, 2025:
Period | | Operating Leases(1) | | Finance Leases | | Total | |||
(in thousands) | |||||||||
2026 | $ | | $ | | $ | | |||
2027 |
| |
| |
| | |||
2028 |
| |
| |
| | |||
2029 |
| |
| |
| | |||
2030 |
| |
| |
| | |||
Thereafter |
| |
| |
| | |||
Total minimum lease payments | $ | | $ | | $ | | |||
Less reconciling items to reconcile undiscounted cash flows to lease liabilities: |
| ||||||||
Leases commencing in the future | | — | | ||||||
Short-term leases excluded from balance sheet | | — | | ||||||
Imputed interest | | | | ||||||
Total reconciling items | | | | ||||||
$ | | $ | | $ | | ||||
| (1) | The table above excludes sublease and lessor income of $ |
NOTE 7—INVENTORIES
Inventories, which are comprised of chemicals and raw materials available for resale, are valued at the lower of cost and net realizable value, with cost determined under the weighted-average method. The significant components of inventory are as follows:
As of December 31, | ||||||
2025 |
| 2024 | ||||
(in thousands) | ||||||
Raw materials | $ | | $ | | ||
Finished goods |
| |
| | ||
Total | $ | | $ | | ||
The Company recorded charges (net credits) to the reserve for excess and obsolete inventory of $
F-29
NOTE 8—PROPERTY AND EQUIPMENT
Property and equipment consists of the following as of December 31, 2025 and 2024:
As of December 31, | ||||||
2025 | | 2024 | ||||
(in thousands) | ||||||
Machinery and equipment | $ | | $ | | ||
Gathering and disposal infrastructure |
| |
| | ||
Pipelines | | | ||||
Recycling facilities | | | ||||
Buildings and leasehold improvements |
| |
| | ||
Land | | | ||||
Computer equipment and software | | | ||||
Vehicles and equipment |
| |
| | ||
Machinery and equipment - finance lease |
| |
| | ||
Office furniture and equipment |
| |
| | ||
Computer equipment and software - finance lease |
| |
| | ||
Construction in progress |
| |
| | ||
| |
| | |||
Less accumulated depreciation(1) |
| ( |
| ( | ||
Total property and equipment, net | $ | | $ | | ||
| (1) | Includes $ |
Total depreciation, amortization and accretion expense related to property and equipment and finance leases presented in the table above, as well as amortization of intangible assets presented in “Note 9—Goodwill and Other Intangible Assets” is as follows:
Year ended December 31, | |||||||||
2025 | 2024 | | 2023 | ||||||
(in thousands) | |||||||||
Category | |||||||||
Depreciation expense from property and equipment | $ | | $ | | $ | | |||
Amortization expense from finance leases | | | | ||||||
Amortization expense from intangible assets | | | | ||||||
Accretion expense from asset retirement obligations | | | | ||||||
Total depreciation, amortization and accretion | $ | | $ | | $ | | |||
Long-lived assets are evaluated for impairment whenever events or changes in circumstances indicate that the carrying amount of an asset may not be recoverable. See “Note 4—Abandonments and Other Costs” for impairment and abandonment of property and equipment during the years ended December 31, 2025, 2024 and 2023.
NOTE 9—GOODWILL AND OTHER INTANGIBLE ASSETS
The Company recorded $
F-30
events and circumstances, concluded that it is not more likely than not that the fair value of the reporting units is less than its carrying amount. Accordingly, no quantitative impairment test was required, and the Company determined there was no impairment of the carrying value of goodwill.
The changes in the carrying amounts of goodwill by reportable segment for the year ended December 31, 2025 and 2024 is as follows:
Water | Water | ||||||||
| Infrastructure | | Services | | Total | ||||
(in thousands) | |||||||||
Balance as of December 31, 2023 | $ | | $ | | $ | | |||
Additions | | — | | ||||||
Balance as of December 31, 2024 | $ | | $ | | $ | | |||
Additions | | — | | ||||||
Balance as of December 31, 2025 | $ | | $ | | $ | | |||
The components of other intangible assets as of December 31, 2025 and 2024 are as follows:
As of December 31, 2025 | As of December 31, 2024 | |||||||||||||||||
| Gross | | Accumulated | | Net | | Gross | Accumulated | | Net | ||||||||
Value | Amortization | Value | Value | Amortization | Value | |||||||||||||
(in thousands) | (in thousands) | |||||||||||||||||
Definite-lived | ||||||||||||||||||
Customer relationships | $ | | $ | ( | $ | | $ | | $ | ( | $ | | ||||||
Patents and other intellectual property | | ( | | | ( | | ||||||||||||
Water rights | | ( | |
| |
| ( |
| | |||||||||
Total definite-lived | | ( | | | ( | | ||||||||||||
Indefinite-lived | ||||||||||||||||||
Water rights | | — | | | — | | ||||||||||||
Total indefinite-lived | | — | | | — | | ||||||||||||
Total other intangible assets, net | $ | | $ | ( | $ | | $ | | $ | ( | $ | | ||||||
The weighted-average periods for customer relationships, patents and other intellectual property, and water rights were
See “Note 8—Property and Equipment” for the amortization expense during the years ended December 31, 2025, 2024 and 2023, respectively. Annual amortization of intangible assets for the next five years and beyond is as follows:
Year Ending December 31, | | Amount | |
(in thousands) | |||
2026 | $ | | |
2027 |
| | |
2028 |
| | |
2029 |
| | |
2030 |
| | |
Thereafter | | ||
Total | $ | | |
F-31
NOTE 10—DEBT
Sustainability-linked credit facility and revolving line of credit
On January 24, 2025 (the “Closing Date”), SES Holdings and Select LLC entered into a $
The Borrowing Base for the Revolving Credit Facility is calculated as the sum of (i)
The Term Advance Borrowing Base for the Term Loan Facility is calculated as the lesser of (i) the product of
Borrowings under the Sustainability-Linked Credit Facility bear interest, at Select LLC’s election, at either Term SOFR (subject to a
F-32
Under the Sustainability-Linked Credit Facility, the interest rate margin and the facility fee rates are also subject to annual adjustments based on the Select LLC’s performance of specified sustainability target thresholds with respect to (i) total recordable incident rate, as the Employee Health and Safety Metric, and (ii) barrels of recycled produced water recycled at facilities of the Credit Parties, as the Water Stewardship Metric, in each case, subject to limited assurance verification by a qualified independent external reviewer. The adjustment for the interest rate margin is a range of plus and minus
The obligations under the Sustainability-Linked Credit Facility are guaranteed by SES Holdings and certain subsidiaries of SES Holdings and Select LLC and secured by a security interest in substantially all of the personal property assets of SES Holdings, Select LLC and their domestic subsidiaries that are guarantors.
The Sustainability-Linked Credit Facility contains certain customary representations and warranties, affirmative and negative covenants and events of default. If an event of default occurs and is continuing, the lenders may declare all amounts outstanding under the Sustainability-Linked Credit Facility to be immediately due and payable.
In addition, the Sustainability-Linked Credit Facility restricts SES Holdings’ and Select LLC’s ability to make distributions on, or redeem or repurchase, its equity interests, except for certain distributions, including distributions of cash so long as, both at the time of the distribution and after giving effect to the distribution, no default or event of default exists under the Sustainability-Linked Credit Facility or would result from the making of such distribution and (a) the fixed charge coverage ratio of SES Holdings is equal to or greater than
The Sustainability-Linked Credit Facility also requires SES Holdings to maintain (i) a fixed charge coverage ratio of at least
Commencing on the first day of the calendar month immediately following the first full fiscal quarter ending after the first anniversary of the closing date, the Term Loan Facility will amortize in quarterly installments equal to $
Certain lenders party to the Sustainability-Linked Credit Facility and their respective affiliates have from time to time performed, and may in the future perform, various financial advisory, commercial banking and investment banking services for the Company and its affiliates in the ordinary course of business for which they have received and would receive customary compensation. In addition, in the ordinary course of their various business activities, such parties and their respective affiliates may make or hold a broad array of investments and actively trade debt and equity securities (or related derivative securities) and financial instruments (including bank loans) for their own account and for the accounts of their customers, and such investments and securities activities may involve the Company’s securities and/or instruments.
In connection with the entry into the Sustainability-Linked Credit Facility, the obligations of SES Holdings, Select LLC and their applicable subsidiaries under the Prior Sustainability-Linked Credit Facility were repaid in full and the Prior Sustainability-Linked Credit Facility was terminated on the Closing Date.
F-33
Prior Sustainability-linked credit facility and revolving line of credit
On March 17, 2022 (the “Restatement Date”), SES Holdings and Select Water Solutions, LLC (“Select LLC”), formerly Select Energy Services, LLC and a wholly-owned subsidiary of SES Holdings, entered into a $
The Prior Sustainability-Linked Credit Facility permitted extensions of credit up to the lesser of $
Borrowings under the Prior Sustainability-Linked Credit Facility bore interest, at Select LLC’s election, at either the (a) one- or three-month Term SOFR (as defined in the Prior Sustainability-Linked Credit Facility) or (b) greatest of (i) the federal funds rate plus
Under the Prior Sustainability-Linked Credit Facility, the interest rate margin and the facility fee rates were also subject to adjustments based on Select LLC’s performance of specified sustainability target thresholds with respect to (i) total recordable incident rate, as the Employee Health and Safety Metric and (ii) barrels of produced water recycled at permanent or semi-permanent water treatment and recycling facilities owned or operated, as the Water Stewardship Metric, in each case, subject to limited assurance verification by a qualified independent external reviewer. The adjustment for the interest rate margin is a range of plus and minus
The obligations under the Prior Sustainability-Linked Credit Facility were guaranteed by SES Holdings and certain subsidiaries of SES Holdings and Select LLC and secured by a security interest in substantially all of the personal property assets of SES Holdings, Select LLC and their domestic subsidiaries.
The Prior Sustainability-Linked Credit Facility contained certain customary representations and warranties, affirmative and negative covenants and events of default. If an event of default occurred and had continued, the lenders
F-34
could have declared all amounts outstanding under the Prior Sustainability-Linked Credit Facility to be immediately due and payable.
In addition, the Prior Sustainability-Linked Credit Facility restricted SES Holdings’ and Select LLC’s ability to make distributions on, or redeem or repurchase, its equity interests, except for certain distributions, including distributions of cash so long as, both at the time of the distribution and after giving effect to the distribution, no default exists under the Prior Sustainability-Linked Credit Facility and either (a) excess availability at all times during the preceding
The Prior Sustainability-Linked Credit Facility also required SES Holdings to maintain a fixed charge coverage ratio of at least
Certain lenders party to the Prior Sustainability-Linked Credit Facility and their respective affiliates have from time to time performed, and may in the future perform, various financial advisory, commercial banking and investment banking services for the Company and its affiliates in the ordinary course of business for which they have received and would receive customary compensation. In addition, in the ordinary course of their various business activities, such parties and their respective affiliates may make or hold a broad array of investments and actively trade debt and equity securities (or related derivative securities) and financial instruments (including bank loans) for their own account and for the accounts of their customers, and such investments and securities activities may involve the Company’s securities and/or instruments.
The Company had $
F-35
The principal maturities of debt outstanding as of December 31, 2025 were as follows:
| Amount | ||||||||
(in thousands) | |||||||||
Revolving Credit Facility | Term Loan | Total | |||||||
2026 | $ | — | $ | | $ | | |||
2027 |
| — | | | |||||
2028 | — | | | ||||||
2029 | — | | | ||||||
2030 | | | | ||||||
Total | $ | | $ | | $ | | |||
Less: Debt issuance costs | — | ( | ( | ||||||
Less: Current portion of long-term debt | — | ( | ( | ||||||
Long-term debt, net | $ | | $ | | $ | | |||
Interest rate as of December 31, 2025 | |||||||||
In connection with the entry into the Sustainability-Linked Credit Facility, the Company incurred $
The Company was in compliance with all debt covenants as of December 31, 2025.
NOTE 11—COMMITMENTS AND CONTINGENCIES
Litigation
The Company is subject to a number of lawsuits and claims arising out of the normal conduct of its business. The ability to predict the ultimate outcome of such matters involves judgments, estimates and inherent uncertainties. Based on a consideration of all relevant facts and circumstances, including applicable insurance coverage, it is not expected that the ultimate outcome of any currently pending lawsuits or claims against the Company will have a material adverse effect on its consolidated financial position, results of operations or cash flows; however, there can be no assurance as to the ultimate outcome of these matters.
Retentions
We are self-insured up to certain retention limits with respect to workers’ compensation, general liability and vehicle liability matters, and health insurance. We maintain accruals for self-insurance retentions that we estimate using third-party data and claims history.
F-36
NOTE 12—EQUITY-BASED COMPENSATION
The SES Holdings 2011 Equity Incentive Plan (the “2011 Plan”) was approved by the board of managers of SES Holdings in April 2011. In conjunction with the private placement of
On March 25, 2024, the Company adopted the Select Water Solutions, Inc. 2024 Equity Incentive Plan (the “2024 Plan”) subject to approval by the Company’s stockholders. On May 8, 2024, the Company’s stockholders approved the 2024 Plan and the 2024 Plan became effective as of such date. The 2024 Plan reserved
Stock Option Awards
The Company has outstanding stock option awards as of December 31, 2025 but there have been
A summary of the Company’s stock option activity and related information as of and for the year ended December 31, 2025 is as follows:
For the year ended December 31, 2025 | |||||||||||||
| Weighted-average | ||||||||||||
Weighted-average | Weighted-average | Remaining Contractual | Aggregate Intrinsic | ||||||||||
| Stock Options | | Grant Date Value | Exercise Price | | Term (Years) | | Value (in thousands) (a) | |||||
Beginning balance, outstanding |
| | $ | | $ | | $ | | |||||
Exercised | ( | | | — | |||||||||
Expired | ( | | | — | |||||||||
Ending balance, outstanding |
| | $ | | $ | | $ | | |||||
Ending balance, exercisable | | $ | | $ | | $ | | ||||||
Nonvested as of December 31, 2025 | — | N/A | $ | — | |||||||||
| (a) | Aggregate intrinsic value for stock options is based on the difference between the exercise price of the stock options and the quoted closing Class A common stock price of $ |
All equity-based compensation expense related to stock options has been previously recognized.
F-37
Restricted Stock Awards
The value of the restricted stock awards granted was established by the market price of the Class A common stock on the date of grant and is recorded as compensation expense ratably over the vesting term, which is generally to
A summary of the Company’s restricted stock awards activity and related information for the year ended December 31, 2025 is as follows:
For the year ended December 31, 2025 | |||||
Weighted-average | |||||
| Restricted Stock Awards | | Grant Date Fair Value | ||
Nonvested as of December 31, 2024 | | $ | | ||
Granted | | | |||
Vested | ( | | |||
Forfeited | ( | | |||
Nonvested as of December 31, 2025 | | $ | | ||
Performance Share Units (“PSUs”)
During 2023, the Company approved grants of PSUs that are subject to both performance-based and service-based vesting provisions related to (i) return on asset (“ROA”) performance in comparison to thirteen peer companies and (ii) Adjusted FCF performance percentage. The number of shares of Class A common stock issued to a recipient upon vesting of the PSUs will be calculated based on ROA and FCF performance over the applicable period from January 1, 2023 through December 31, 2025.
The target number of shares of Class A common stock subject to each remaining PSU granted in 2023 is
The target PSUs granted in 2023 that become earned connected with the ROA in comparison to other companies will be determined based on the Company’s Average ROA (as defined in the applicable PSU agreement) relative to the Average ROA of the peer companies (as defined in the applicable PSU agreement) in accordance with the following table, but the Company must have a positive Total Shareholder Return (“TSR”)(as defined in the applicable PSU agreement) over the performance period. As a result of this market condition, the 2023 PSUs will be valued each reporting period utilizing a Black-Scholes model.
Ranking Among Peer Group | Percentage of Target Amount Earned | |
Outside of Top 10 | ||
Top 10 | ||
Top 7 | ||
Top 3 |
F-38
The target PSUs that become earned in connection with the adjusted FCF performance percentage will be determined (as defined in the applicable PSU agreement) in accordance with the following table:
Adjusted FCF Performance Percentage | Percentage of Target Amount Earned | |
Less than 70% | ||
70% | ||
100% | ||
130% |
During 2024, the Company approved grants of PSUs that are subject to both performance-based and service-based vesting provisions related to ROA in comparison to twelve peer companies and PSUs subject to market-based and service-based vesting provisions related to absolute TSR over the performance period from January 1, 2024 through December 31, 2026. The target number of shares of Class A common stock subject to each PSU granted in 2024 is
The target PSUs granted in 2024 that become earned in connection with the ROA in comparison to other companies will be determined (as defined in the applicable PSU agreement) in accordance with the following table:
Ranking Among Peer Group | Percentage of Target Amount Earned | |
Outside of Top 10 | ||
Top 10 | ||
Top 7 | ||
Top 3 |
The PSUs granted in 2024 that become earned in connection with TSR will be determined (as defined in the applicable PSU agreement) in accordance with the following table:
Performance Level | Absolute TSR (%) | Percentage of Target PSUs Earned | ||
Below Threshold | Less than 0% | |||
Threshold | 0% | |||
Target | 10% | |||
Maximum | Greater than or equal to 30% |
During 2025, the Company approved grants of PSUs that are subject to both performance-based and service-based vesting provisions related to relative and absolute TSR, with relative TSR measured against a defined peer group specified in the grant agreement, over the performance period from January 1, 2025 to December 31, 2027. The target number of shares of Class A common stock subject to each PSU granted in 2025 is
F-39
The PSUs granted in 2025 that become earned in connection with TSR will be determined (as defined in the applicable PSU agreement) in accordance with the following table:
Performance Level | Relative TSR (%) | Absolute TSR between 0% and 15%* | Absolute TSR greater than 15% | Absolute TSR less than 0% | |||
Maximum | Greater than or equal to 80% | ||||||
Target | 55% | ||||||
Threshold | 25% | ||||||
Below Threshold | Less than 25% |
*The percentage of target PSUs that become earned PSUs for performance that is between the values set forth in the table above, excluding between the third and fourth rows of the table, shall be linearly interpolated between the values in the table.
The fair value on the date the PSUs were granted during 2025, 2024 and 2023 was $
As of December 31, 2025, the unrecognized compensation cost related to our unvested PSUs is estimated to be $
The following table summarizes the information about the PSUs outstanding as of December 31, 2025:
| PSUs | |
Nonvested as of December 31, 2024 | | |
Target shares granted | | |
Target shares vested (1) | ( | |
Target shares added by performance factor | | |
Target shares forfeited (1) | ( | |
Target shares outstanding as of December 31, 2025 | |
| (1) | The PSUs granted in 2022 related to ROA and FCF vested at |
Share Repurchases
During the years ended December 31, 2025 and 2024, the Company repurchased
The 1% U.S. federal excise tax on certain repurchases of stock by publicly traded U.S. corporations enacted as part of the IRA 2022 applies to our share repurchase program.
F-40
NOTE 13—FAIR VALUE MEASUREMENT
The Company utilizes fair value measurements to measure assets and liabilities in a business combination or assess impairment and abandonment of property and equipment, intangible assets and goodwill or to measure the value of securities marked to market. Fair value is defined as the amount at which an asset (or liability) could be bought (or incurred) or sold (or settled) in an orderly transaction between market participants at the measurement date. Further, ASC 820, Fair Value Measurements, establishes a framework for measuring fair value, establishes a fair value hierarchy based on the quality of inputs used to measure fair value, and includes certain disclosure requirements. Fair value estimates are based on either (i) actual market data or (ii) assumptions that other market participants would use in pricing an asset or liability, including estimates of risk.
ASC 820 establishes a three-level valuation hierarchy for the disclosure of fair value measurements. The valuation hierarchy categorizes assets and liabilities measured at fair value into one of three different levels depending on the observability of the inputs employed in the measurement. The three levels are defined as follows:
Level 1—Unadjusted quoted prices for identical assets or liabilities in active markets.
Level 2—Quoted prices for similar assets or liabilities in non-active markets, and inputs that are observable for the asset or liability, either directly or indirectly, for substantially the full term of the financial instrument.
Level 3—Inputs that are unobservable and significant to the fair value measurement (including the Company’s own assumptions in determining fair value).
A financial instrument’s categorization within the valuation hierarchy is based upon the lowest level of input that is significant to the fair value measurement. The Company’s assessment of the significance of a particular input to the fair value measurement in its entirety requires judgment and considers factors specific to the asset or liability. There were
Assets and liabilities measured at fair value on a recurring and non-recurring basis
Nonfinancial assets and liabilities measured at fair value on a non-recurring basis include certain nonfinancial assets and liabilities as may be acquired in a business combination or asset acquisition, AROs and measurements of goodwill and intangible impairment. As there is no corroborating market activity to support the assumptions used, the Company has designated these measurements as Level 3.
Long-lived assets, such as property and equipment and finite-lived intangible assets, are evaluated for impairment whenever events or changes in circumstances indicate that its carrying value may not be recoverable. The development of future cash flows and the estimate of fair value represents the Company’s best estimates based on industry trends and reference to market transactions and are subject to variability.
The Company’s estimates of fair value have been determined at discrete points in time based on relevant information. These estimates involve uncertainty and cannot be determined with precision. There were no significant changes in valuation techniques or related inputs for the years ended December 31, 2025, 2024 and 2023.
F-41
The following table presents information about the Company’s assets measured at fair value on a recurring and non-recurring basis for the year ended December 31, 2023.
Fair Value | |||||||||||||||||||
Measurements Using | Carrying | ||||||||||||||||||
Level 1 | Level 2 | Level 3 | Value(1) | Abandonment(2) | |||||||||||||||
(in thousands) | |||||||||||||||||||
Year Ended December 31, 2023 | |||||||||||||||||||
Trademark | Non-recurring | March 31 | $ | — | $ | — | $ | | $ | | $ | | |||||||
| (1) | Amount represents carrying value at the date of assessment. |
| (2) | See “Note 4—Abandonments and Other Costs for more information on the abandonments reflected above and incurred during the year ended December 31, 2023. |
Other fair value considerations
Also, see “Note 3—Acquisitions” for a discussion of the fair value incorporated into the purchase price allocation for acquisitions occurring during the years ended December 31, 2025, 2024 and 2023.
The carrying values of the Company’s current financial instruments, which include cash and cash equivalents, accounts receivable trade and accounts payable, approximate their fair value as of December 31, 2025 and 2024 due to the short-term nature of these instruments. The carrying value of debt as of December 31, 2025 and December 31, 2024 approximates fair value due to variable market rates of interest. The estimated fair values of the Company’s financial instruments are not necessarily indicative of the amounts that would be realized in a current market exchange.
NOTE 14—RELATED PARTY TRANSACTIONS
The Company considers its related parties to be those stockholders who are beneficial owners of more than
During the year ended December 31, 2025, sales to related parties were $
During the year ended December 31, 2024, sales to related parties were $
During the year ended December 31, 2023, sales to related parties were $
F-42
Tax Receivable Agreements
In connection with the Select 144A Offering, the Company entered into two TRAs with certain then-affiliates of the then-holders of SES Holdings LLC Units. As of December 31, 2025, certain of the TRA Holders were employed by the Company, on the Company’s board of directors and/or owned shares of the Company’s Class A and/or Class B common stock. During 2025, TRA Holders who are related parties did not receive any TRA payments.
The first of the TRAs, which the Company entered into with Legacy Owner Holdco and Crestview Partners II GP, L.P. (“Crestview GP”) generally provides for the payment by the Company to such TRA Holders of
The second of the TRAs, which the Company entered into with an affiliate of Legacy Owner Holdco and Crestview GP, generally provides for the payment by the Company to such TRA Holders of
On June 23, 2023, the TRAs were amended to replace references to one year LIBOR with references to the 12-month term published by CME Group Benchmark Administration Limited plus
The Company has recognized a liability associated with the TRAs as of December 31, 2025 and December 31, 2024 of $
NOTE 15—INCOME TAXES
Select Inc. is subject to U.S. federal and state income taxes as a corporation. SES Holdings and its subsidiaries, with the exception of certain corporate subsidiaries, are treated as flow-through entities for U.S. federal income tax purposes and as such, are generally not subject to U.S. federal income tax at the entity level. Rather, the tax liability with
F-43
respect to their taxable income is passed through to their members or partners. Select Inc. recognizes a tax liability on its allocable share of SES Holdings’ taxable income.
The U.S. and non-U.S. components of income before income tax expense for the year ended December 31, 2025 is as follows:
For the year ended | |||
December 31, | |||
| 2025 | ||
(in thousands) | |||
| | ||
U.S. | $ | | |
Non-U.S. |
| ( | |
Total | $ | | |
The components of the federal and state income tax (benefit) expense are summarized as follows:
For the year ended | |||||||||
December 31, | |||||||||
| 2025 | | 2024 | | 2023 | ||||
(in thousands) | |||||||||
Current tax (benefit) expense |
| |
| |
| | |||
Federal income tax expense | $ | — | $ | | $ | | |||
State and local income tax (benefit) expense |
| ( |
| |
| | |||
Total current (benefit) expense |
| ( |
| |
| | |||
Deferred tax (benefit) expense |
| |
| |
| | |||
Federal income tax (benefit) expense |
| ( |
| |
| ( | |||
State and local income tax expense (benefit) |
| |
| ( |
| ( | |||
Total deferred (benefit) expense |
| ( |
| |
| ( | |||
Total income tax (benefit) expense | $ | ( | $ | | $ | ( | |||
Tax (benefit) expense attributable to controlling interests | $ | ( | $ | | $ | ( | |||
Tax expense attributable to noncontrolling interests |
| |
| |
| | |||
Total income tax (benefit) expense | $ | ( | $ | | $ | ( | |||
The Company’s effective tax rates for the years ended December 31, 2025, 2024 and 2023 were (
F-44
A reconciliation of the Company’s provision for income taxes as reported and the amount computed by multiplying income before taxes, less noncontrolling interests, by the U.S. federal statutory rate of
| For the year ended December 31, 2025 | |||||||
Amount |
| Percent | ||||||
(in thousands) | ||||||||
Provision calculated at federal statutory income tax rate: |
| | | |||||
Income before equity in losses of unconsolidated entities and taxes | $ | | ||||||
Equity in losses of unconsolidated entities | ( | |||||||
Income before taxes | | |||||||
Income tax expense computed at statutory rate |
| | | % | ||||
United States |
| |||||||
| | | ||||||
Tax Credits |
| |||||||
Research and development credits | ( | ( | ||||||
Energy investment credits | ( | ( | ||||||
Change in valuation allowance | ( | ( | ||||||
Nontaxable or nondeductible items | ||||||||
Compensation Items |
| | | |||||
Meals and Entertainment | | | ||||||
Other | | | ||||||
Other Adjustments | ||||||||
Impact of noncontrolling interests | ( | ( | ||||||
Other | | | ||||||
Non-U.S. Tax Effects | ||||||||
Other jurisdictions | | | ||||||
Total income tax benefit | $ | ( | ( | % | ||||
**State taxes in Texas and Colorado comprise greater than 50 percent of the tax effect in this category.
F-45
A reconciliation of the Company’s provision for income taxes as reported and the amount computed by multiplying income before taxes, less noncontrolling interests, by the U.S. federal statutory rate of
| For the year ended December 31, | |||||||
2024 |
| 2023 | ||||||
(in thousands) | ||||||||
Provision calculated at federal statutory income tax rate: |
| | | |||||
Income before equity in losses of unconsolidated entities and taxes | $ | | $ | | ||||
Equity in losses of unconsolidated entities | ( | ( | ||||||
Income before taxes | | | ||||||
Statutory rate |
| | % |
| | % | ||
Income tax expense computed at statutory rate |
| |
| | ||||
Less: noncontrolling interests |
| ( |
| ( | ||||
Income tax expense attributable to controlling interests |
| |
| | ||||
State and local income taxes, net of federal benefit |
| |
| | ||||
State rate change |
| |
| | ||||
Deferred tax adjustments and carryforward expirations | | | ||||||
Change in valuation allowance |
| ( |
| ( | ||||
Nondeductible items | | | ||||||
Income tax expense (benefit) attributable to controlling interests |
| |
| ( | ||||
Income tax expense attributable to noncontrolling interests |
| |
| | ||||
Total income tax expense (benefit) | $ | | $ | ( | ||||
The following table presents income taxes paid (net of refunds received) for the year ended December 31, 2025 (in thousands):
| For the year ended December 31, | ||
2025 | |||
(in thousands) | |||
| | ||
U.S. Federal | $ | | |
U.S. State and Local | |||
Texas | | ||
Oklahoma |
| ( | |
Pennsylvania |
| | |
Other | | ||
Total income tax paid (net of refunds received) | $ | | |
F-46
Deferred taxes result from the temporary differences between financial reporting carrying amounts and the tax basis of existing assets and liabilities. Deferred tax liabilities are recorded in other long-term liabilities on the consolidated balance sheets. The principal components of the deferred tax assets (liabilities) are summarized as follows:
As of year ended | ||||||
December 31, | ||||||
| 2025 | | 2024 | |||
(in thousands) | ||||||
Deferred tax assets |
| |
| | ||
Outside basis difference in SES Holdings | $ | — | $ | | ||
Net operating losses |
| |
| | ||
Credits and other carryforwards |
| |
| | ||
Other | | | ||||
Total deferred tax assets before valuation allowance |
| |
| | ||
Valuation allowance | ( | ( | ||||
Total deferred tax assets | | | ||||
Deferred tax liabilities |
| |
| | ||
Outside basis difference in SES Holdings |
| ( |
| — | ||
Property and equipment |
| ( |
| ( | ||
Total deferred tax liabilities |
| ( |
| ( | ||
Net deferred tax assets | $ | | $ | | ||
The change in the valuation allowance is as follows:
For the year ended | ||||||
December 31, | ||||||
2025 | | 2024 | ||||
(in thousands) | ||||||
Balance at the beginning of the year | $ | |
| $ | | |
Deductions(1) | ( |
| ( | |||
Balance at the end of the year | $ | |
| $ | | |
| (1) | For the year ended December 31, 2025 and December 31, 2024, the net decreases are primarily a result of adjustments to partially reserved deferred tax assets. |
The Company regularly reviews its deferred tax assets for realization and establishes a valuation allowance if it is more likely than not that some portion or all of a deferred tax asset will not be realized. The Company considers all available positive and negative evidence in determining whether realization of the tax benefit is more likely than not. This evidence includes historical income / loss, projected future income, the expected timing of the reversal of existing temporary differences and the implementation of tax planning strategies. In the Company's evaluation of the need for and amount of a valuation allowance on its deferred tax assets, the Company places the most weight on objectively verifiable direct evidence, including its recent and historical operating results and continuing its operating profitability. The specific positive factors and evidence considered in the realizability of its deferred tax assets include the cumulative pre-tax income that the Company generated over the past three-year period and the expectation of income in future periods. As of December 31, 2025 and 2024, the Company has evaluated the realizability of its deferred tax assets and made adjustments based upon the available positive and negative evidence.
As of December 31, 2025, the Company and certain of its corporate subsidiaries had approximately $
F-47
approximately $
Accounting for uncertainty in income taxes prescribes a recognition threshold and measurement methodology for the financial statement recognition and measurement of a tax position taken or expected to be taken in a tax return. As of December 31, 2025 and 2024 there was
Separate U.S. federal and state income tax returns are filed for Select Inc., SES Holdings and certain consolidated affiliates. The tax years 2022 through 2024 remain open to examination by the major taxing jurisdictions in which the Company is subject to income tax.
NOTE 16—NONCONTROLLING INTERESTS
The Company’s noncontrolling interests fall into two categories as follows:
| ● | Noncontrolling interests attributable to joint ventures formed for water-related services. |
| ● | Noncontrolling interests attributable to holders of Class B common stock. |
As of December 31, | ||||||
| 2025 | | 2024 | |||
(in thousands) | ||||||
Noncontrolling interests attributable to joint ventures formed for water-related services | $ | ( | | $ | ( | |
Noncontrolling interests attributable to holders of Class B common stock | | |
| | ||
Total noncontrolling interests | $ | | | $ | | |
During the year ended December 31, 2025, the Company received a $
For all periods presented, there were changes in Select Inc.’s ownership interest in SES Holdings. The effects of the changes in Select Inc.’s ownership interest in SES Holdings are as follows:
For the year ended December 31, | |||||||||
2025 | | 2024 | | 2023 | |||||
(in thousands) | |||||||||
Net income attributable to Select Water Solutions, Inc. | $ | | | $ | | | $ | | |
Transfers from noncontrolling interests: | |
| |
| |||||
Decrease in additional paid-in capital as a result of issuing shares for business combination | ( | — | | ||||||
Increase in additional paid-in capital as a result of restricted stock issuance, net of forfeitures |
| | |
| | |
| | |
Increase in additional paid-in capital as a result of vested PSUs | | | — | ||||||
Increase in additional paid-in capital as a result of the repurchase of SES Holdings LLC Units |
| | |
| | |
| | |
Change to equity from net income attributable to Select Water Solutions, Inc. and transfers from noncontrolling interests | $ | | | $ | | | $ | | |
F-48
Variable Interest Entity (“VIE”)
Noncontrolling interests deficit of $
While multiple partners contributed capital to the subsidiary, the Company provided approximately
NOTE 17— INCOME PER SHARE
Income per share is based on the amount of income allocated to the stockholders and the weighted-average number of shares outstanding during the period for each class of common stock. Outstanding options are included in the calculation of diluted weighted-average shares outstanding to the extent they may be dilutive upon exercise and are excluded to the extent they would be antidilutive. Accordingly, outstanding options to purchase
The following tables present the Company’s calculation of basic and diluted earnings per share for the years ended December 31, 2025, 2024 and 2023 (dollars in thousands, except share and per share amounts):
Year ended December 31, 2025 | |||||||||
| Select Water Solutions, Inc. | | Class A | | Class B | ||||
Numerator: | |||||||||
Net income | $ | | |||||||
Net income attributable to noncontrolling interests | ( | ||||||||
Net income attributable to Select Water Solutions, Inc. — basic | $ | | $ | | $ | — | |||
Add: Reallocation of net income attributable to noncontrolling interests for the dilutive effect of restricted stock | | | — | ||||||
Add: Reallocation of net income attributable to noncontrolling interests for the dilutive effect of performance units | | | — | ||||||
Add: Reallocation of net income attributable to noncontrolling interests for the dilutive effect of stock options | | | — | ||||||
Net income attributable to Select Water Solutions, Inc. — diluted | $ | | $ | | $ | — | |||
Denominator: | |||||||||
Weighted-average shares of common stock outstanding — basic | | | |||||||
Dilutive effect of restricted stock | | — | |||||||
Dilutive effect of performance share units | | — | |||||||
Dilutive effect of stock options | | — | |||||||
Weighted-average shares of common stock outstanding — diluted | | | |||||||
Income per share: | |||||||||
Basic | $ | | $ | — | |||||
Diluted | $ | | $ | — | |||||
F-49
Year ended December 31, 2024 | |||||||||
Select Water Solutions, Inc. | Class A | Class B | |||||||
Numerator: | |||||||||
Net income | $ | | |||||||
Net income attributable to noncontrolling interests | ( | ||||||||
Net income attributable to Select Water Solutions, Inc. — basic | $ | | $ | | $ | — | |||
Add: Reallocation of net income attributable to noncontrolling interests for the dilutive effect of restricted stock | | | — | ||||||
Add: Reallocation of net income attributable to noncontrolling interests for the dilutive effect of performance units | | | — | ||||||
Add: Reallocation of net income attributable to noncontrolling interests for the dilutive effect of stock options | | | — | ||||||
Net income attributable to Select Water Solutions, Inc. — diluted | $ | | $ | | $ | — | |||
Denominator: | |||||||||
Weighted-average shares of common stock outstanding — basic | | | |||||||
Dilutive effect of restricted stock | | — | |||||||
Dilutive effect of performance share units | | — | |||||||
Dilutive effect of stock options | | — | |||||||
Weighted-average shares of common stock outstanding — diluted | | | |||||||
Income per share: | |||||||||
Basic | $ | | $ | — | |||||
Diluted | $ | | $ | — | |||||
Year ended December 31, 2023 | |||||||||
Select Water Solutions, Inc. | Class A | Class B | |||||||
Numerator: | |||||||||
Net income | $ | | |||||||
Net income attributable to noncontrolling interests | ( | ||||||||
Net income attributable to Select Water Solutions, Inc. — basic | $ | | $ | | $ | — | |||
Add: Reallocation of net income attributable to noncontrolling interests for the dilutive effect of restricted stock | | | — | ||||||
Add: Reallocation of net income attributable to noncontrolling interests for the dilutive effect of performance share units | | | — | ||||||
Net income attributable to Select Water Solutions, Inc. — diluted | $ | | $ | | $ | — | |||
Denominator: | |||||||||
Weighted-average shares of common stock outstanding — basic | | | |||||||
Dilutive effect of restricted stock | | — | |||||||
Dilutive effect of performance share units | | — | |||||||
Weighted-average shares of common stock outstanding — diluted | | | |||||||
Income per share: | |||||||||
Basic | $ | | $ | — | |||||
Diluted | $ | | $ | — | |||||
NOTE 18—SEGMENT INFORMATION
Select is a leading provider of sustainable water and chemical solutions to the energy industry in the U.S. The Company’s services are offered through
The Company’s CODM assesses performance and allocates resources on the basis of the following
Water Infrastructure — The Water Infrastructure segment consists of the Company’s fixed infrastructure assets, including operations associated with our water distribution pipeline infrastructure, our water recycling facilities, our produced water gathering pipelines, SWDs, and our solids management facilities, primarily serving E&P companies.
F-50
Water Services — The Water Services segment primarily consists of the Company’s water-related services businesses, including water sourcing, water transfer, fluids hauling, water monitoring, water containment and water network automation, primarily serving E&P companies. Additionally, this segment includes the operations of our Peak Rentals businesses.
Chemical Technologies — The Chemical Technologies segment provides technical solutions, products and expertise related to chemical applications in the oil and gas industry. We develop, manufacture, manage logistics and provide a full suite of chemicals used in hydraulic fracturing, stimulation, cementing and well completions for customers ranging from pressure pumpers to major integrated and independent oil and gas producers. This segment also utilizes its chemical experience and lab testing capabilities to customize tailored water treatment solutions designed for the recycling and treatment of produced water and to optimize the fracturing fluid system in conjunction with the quality of water used in well completions.
In assessing segment results and allocating resources, the CODM places particular emphasis on significant expense categories, including cost of revenue, selling, general & administrative expenses, and depreciation, accretion, and amortization. The CODM evaluates segment performance primarily based on segment EBITDA, which serves as the key profitability measure for decision-making. The Company reports EBITDA by segment as a measure of segment performance. The Company defines EBITDA as net income, plus interest expense, income taxes, and depreciation, amortization and accretion.
Financial information by segment for the years ended December 31, 2025, 2024 and 2023 is as follows:
For the year ended December 31, 2025 | ||||||||||||||||||
| | | | |||||||||||||||
Water Infrastructure | Water Services | Chemical Technologies | Other | Eliminations | Totals | |||||||||||||
Revenue | $ | | $ | | $ | | $ | - | $ | ( | $ | | ||||||
Costs of revenue excluding depreciation, amortization and accretion | ( | ( | ( | - | | ( | ||||||||||||
Depreciation, amortization and accretion | ( | ( | ( | ( | ( | |||||||||||||
Selling general and administrative | ( | ( | ( | ( | ( | |||||||||||||
Other(1) | ( | | | ( | | |||||||||||||
Net income | $ | | ||||||||||||||||
Interest expense, net | | |||||||||||||||||
Tax benefit | ( | |||||||||||||||||
Depreciation, amortization and accretion | | |||||||||||||||||
EBITDA | $ | | $ | | $ | | $ | ( | $ | | ||||||||
Capital expenditures | $ | | $ | | $ | | $ | | $ | | ||||||||
Total assets, end of period | $ | | $ | | $ | | $ | | $ | | ||||||||
For the year ended December 31, 2024 | ||||||||||||||||||
| | | | |||||||||||||||
Water Infrastructure | Water Services | Chemical Technologies | Other | Eliminations | Totals | |||||||||||||
Revenue | $ | | $ | | $ | | $ | - | $ | ( | $ | | ||||||
Costs of revenue excluding depreciation, amortization and accretion | ( | ( | ( | - | | ( | ||||||||||||
Depreciation, amortization and accretion | ( | ( | ( | ( | ( | |||||||||||||
Selling general and administrative | ( | ( | ( | ( | ( | |||||||||||||
Other(1) | | | ( | ( | ( | |||||||||||||
Net income | $ | | ||||||||||||||||
Interest expense, net | | |||||||||||||||||
Tax expense | | |||||||||||||||||
Depreciation, amortization and accretion | | |||||||||||||||||
EBITDA | $ | | $ | | $ | | $ | ( | $ | | ||||||||
Capital expenditures | $ | | $ | | $ | | $ | | $ | | ||||||||
Total assets, end of period | $ | | $ | | $ | | $ | | $ | | ||||||||
F-51
For the year ended December 31, 2023 | ||||||||||||||||||
| | | | |||||||||||||||
Water Infrastructure | Water Services | Chemical Technologies | Other | Eliminations | Totals | |||||||||||||
Revenue | $ | | $ | | $ | | $ | - | $ | ( | $ | | ||||||
Costs of revenue excluding depreciation, amortization and accretion | ( | ( | ( | - | | ( | ||||||||||||
Depreciation, amortization and accretion | ( | ( | ( | ( | ( | |||||||||||||
Selling general and administrative | ( | ( | ( | ( | ( | |||||||||||||
Other(1) | ( | | ( | ( | ( | |||||||||||||
Net income | $ | | ||||||||||||||||
Interest expense, net | | |||||||||||||||||
Tax benefit | ( | |||||||||||||||||
Depreciation, amortization and accretion | | |||||||||||||||||
EBITDA | $ | | $ | | $ | | $ | ( | $ | | ||||||||
Capital expenditures | $ | | $ | | $ | | $ | | $ | | ||||||||
| (1) |
Revenue by groups of similar products and services is as follows:
For the year ended December 31, | |||||||||
| 2025 | | 2024 | 2023 | |||||
(in thousands) | |||||||||
Water transfer, monitoring and sourcing | $ | | $ | | $ | | |||
Chemical technologies | | | | ||||||
Fluids hauling | | | | ||||||
Water recycling and reuse |
| |
| | | ||||
Fluids disposal | | | | ||||||
Accommodations and rentals |
| | | | |||||
Flowback and well testing | | | | ||||||
Water containment | | | | ||||||
Solids management | | | | ||||||
Pipelines and logistics | | | | ||||||
Eliminations and other service lines |
| ( |
| ( | ( | ||||
Total | $ | | $ | | $ | | |||
F-52